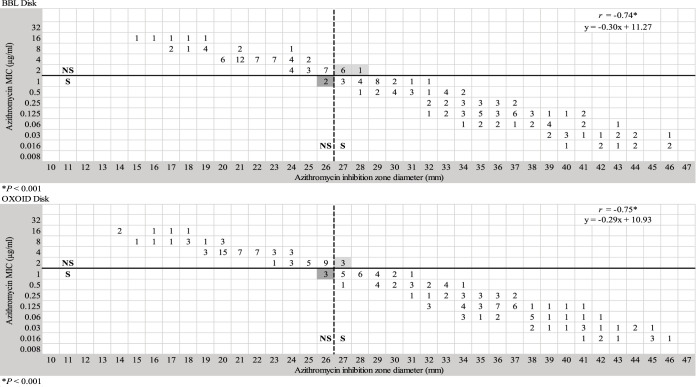
FIG 1.
Scattergram of MICs versus zone diameters (n = 189) for 15-μg azithromycin disks from BBL and Oxoid. The horizontal solid line represents the CLSI breakpoint for azithromycin. The vertical dashed line indicates the zone diameter breakpoint proposed in this study. Very major and major discrepancies are highlighted in light gray and dark gray, respectively.

