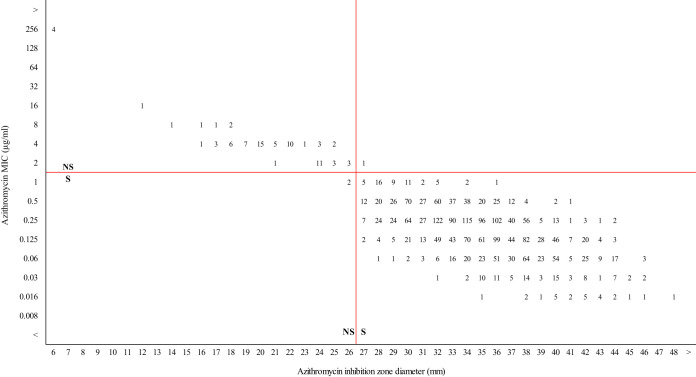
FIG 2.
Retrospective analysis of azithromycin MICs versus inhibition zone diameters for 2,344 N. gonorrhoeae isolates cultured across Argentina from 2016 to June 2019. The horizontal red solid line represents the CLSI breakpoint for azithromycin. The vertical red solid line indicates the zone diameter breakpoint proposed in this study.

