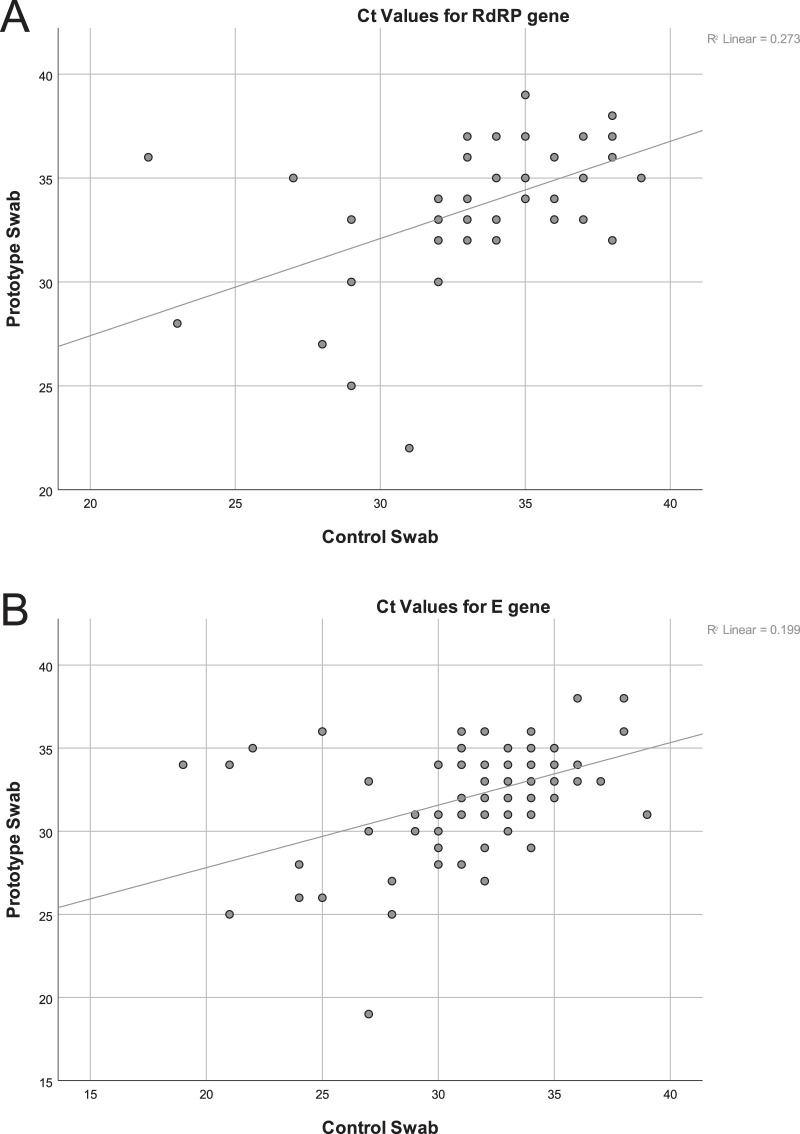
FIG 4.
Cycle threshold (CT) values from nasopharyngeal samples collected using the prototype swab relative to those collected using the control swab. (A) Using values related to the RNA-dependent RNA polymerase (RdRP) gene (n = 36). (B) Using values related to the E gene (n = 57). Please note that threshold values for negative results were not included in the scatterplot. Only CT values that were available from the lab and concordant are represented in the figures.

