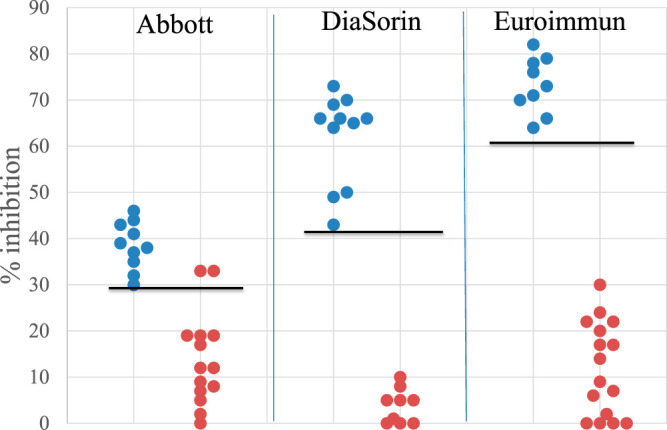
FIG 1.

Results from inhibition assays. Blue dots represent samples positive in all 4 assays (TP samples); red dots represent samples that were positive only in the indicated assay. Values for the Abbott assay represent percent inhibition by nucleocapsid, values for the DiaSorin assay represent percent inhibition by S1+S2 proteins, and values for the Euroimmun assay represent percent inhibition by S1 protein. The horizonal lines indicate the assay-specific inhibition value below which reactivity is considered FP.
