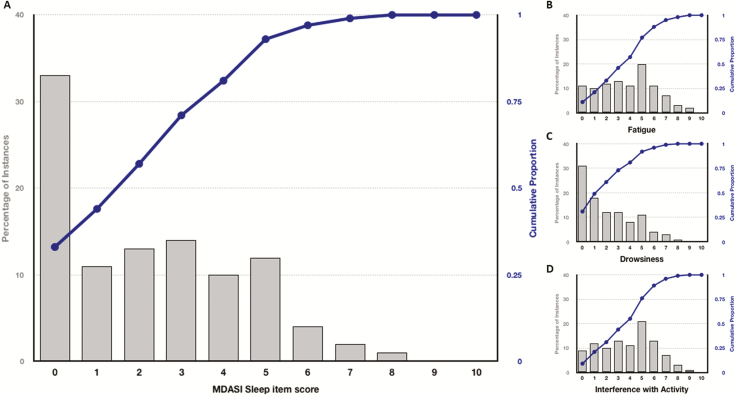
Figure 2.
Distribution of MDASI sleep, fatigue, drowsiness, and interference with activity item scores. Panels show the percentage of occurrences (gray bars) of the MDASI sleep (A), fatigue (B), drowsiness (C), and interference with activity (D) scores (ranging 0–10), respectively, as rated by the patients and their cumulative proportion (blue line).

