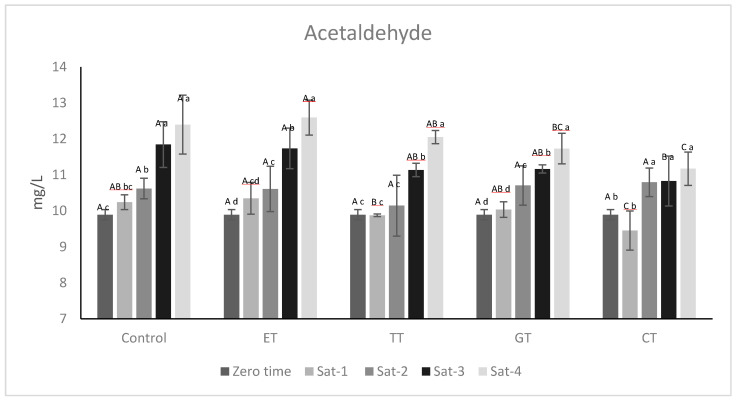
Figure 4.
Evolution of acetaldehyde. All the data are expressed as means ± standard deviation. Different letters indicate a statistically significant difference among treated wines during each saturation time (A, B, C, D) and among treated wines for the same saturation time (a, b, c, d). All the data are expressed as means ± standard deviation, (p < 0.05).

