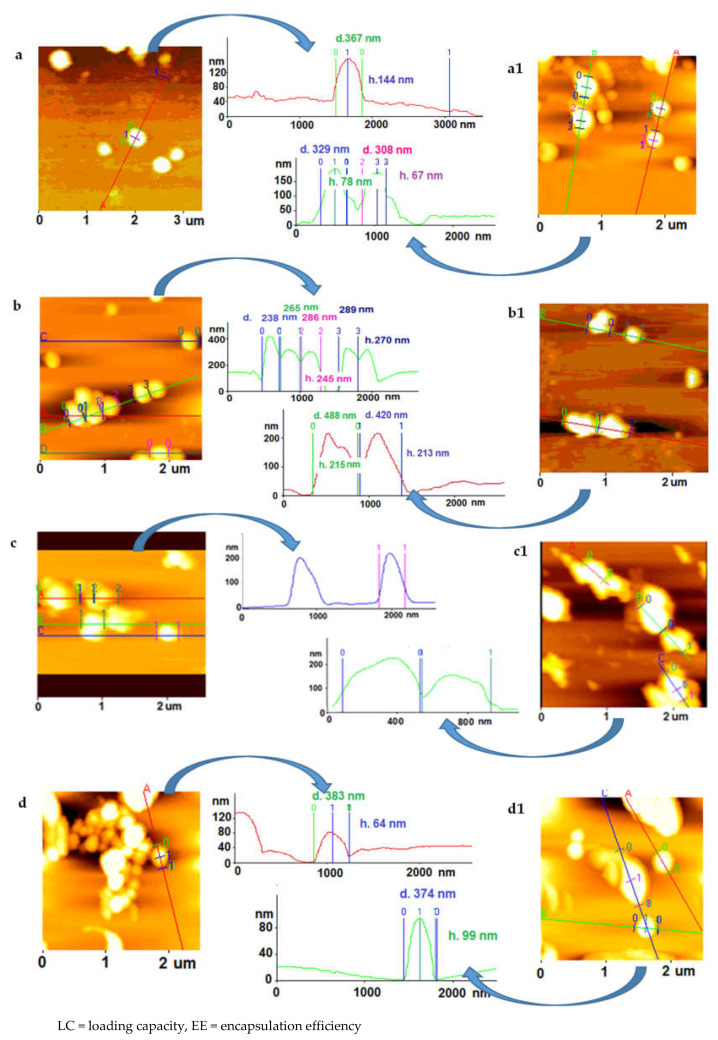
Figure 3.
AFM images of the different NP preparations (a) NPs, (a1) NPs/B-GLU, (b) NPs/BSA 0,15 nM, (b1) NPs/Complex 1, (c) NPs/BSA 0,75 nM, (c1) NPs/Complex 2, (d) NPs/BSA 1,5 nM, (d1) NPs/Complex 3. Note: All NPs containing BSA:enzyme complex were produced with 5 mg B-Glu. The control samples are highlighted in grey.

