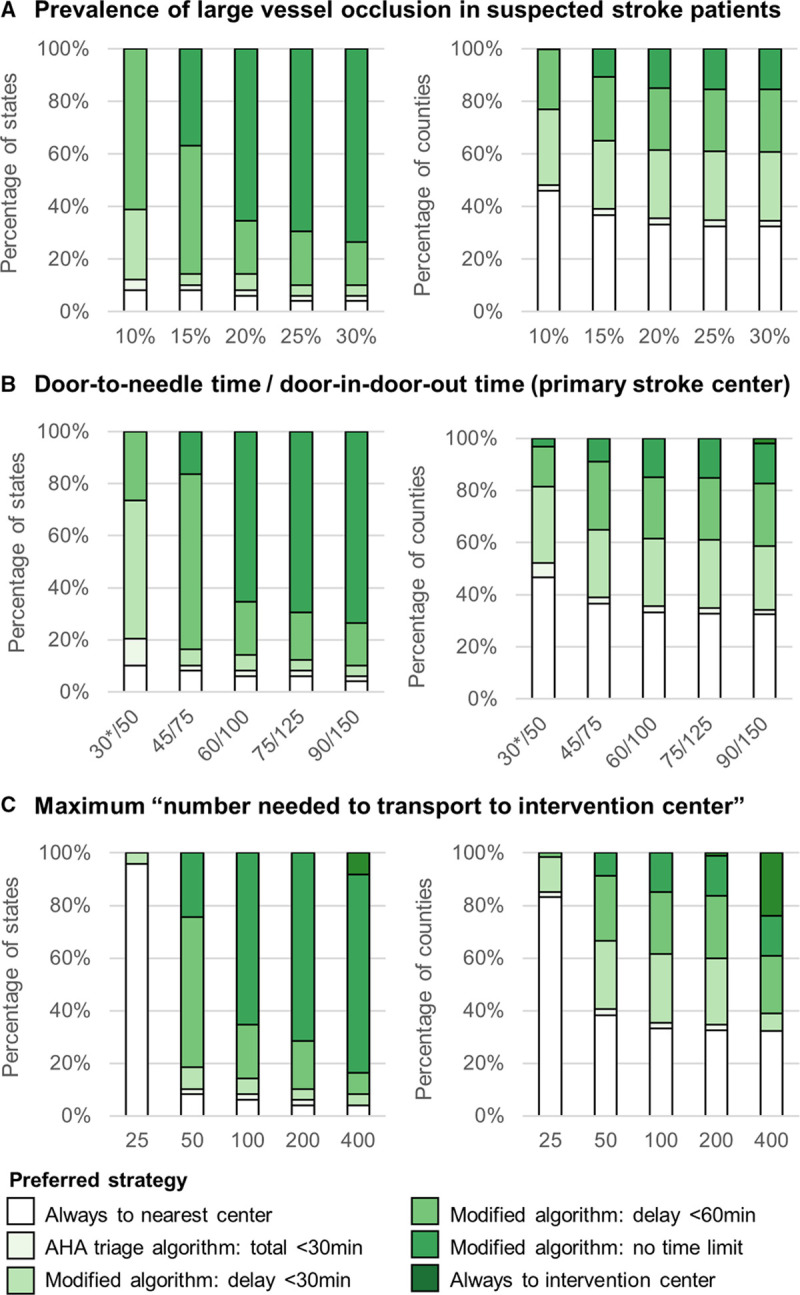
Figure 3.

Results of the sensitivity analyses. A–C, The state-level and county-level distribution of preferred prehospital triage strategies with changing prevalence of large vessel occlusion, workflow times in the primary stroke center, and maximum accepted number needed to transport to intervention center to prevent one death or severe disability. AHA indicates American Heart Association. *In this scenario, the door-to-needle time in the intervention center was also adjusted to 30 min.
