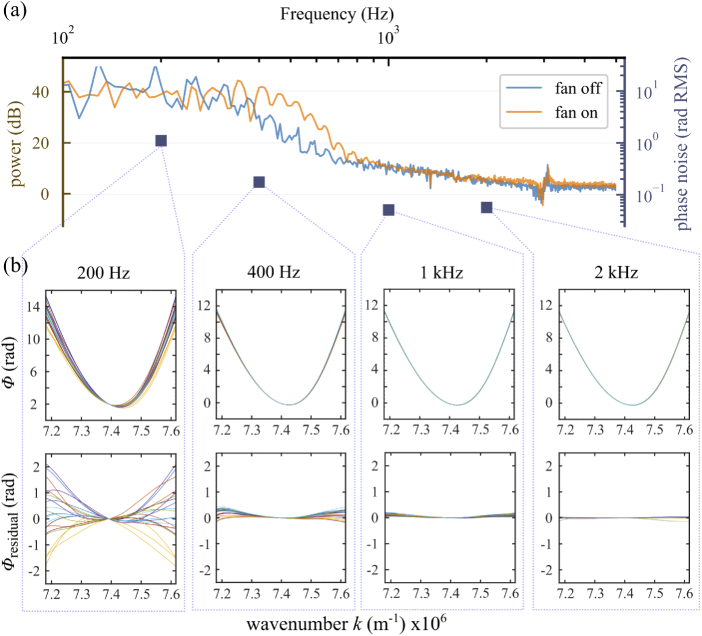
Fig. 3.
Spectral analysis of system vibrations. (a) Power spectrum of fluctuations in the off-axis carrier fringe (possibly due to system vibrations) measured with model eye (consisting of a lens and a mirror positioned at its back focal plane) in the sample channel, with the camera fan on and off; blue squares show the standard deviation of chirp () measured over 20 volumes acquired at selected rates within the frequency range. It is apparent that increasing volume rates reduces chirp, and that this reduction qualitatively follows the power spectrum. (b) (top) Phase correction () for 20 volumes acquired with the AO-FF-SS-OCT at different volume rates (specified at the top of each plot) and calculated numerically using the STFT dechirping approach; the characteristic curve suggests a constant component due to deterministic nonlinearity in the sweep. (bottom) The average at 2 kHz was used as a proxy for the constant chirp component and subtracted from each phase correction curve to visualize the residual chirp caused, for example, by system vibrations or noise in the source. This illustrates the importance of applying high order corrections for -stack dechirping, correcting volumes individually, and the potential advantage of higher volume rates.

