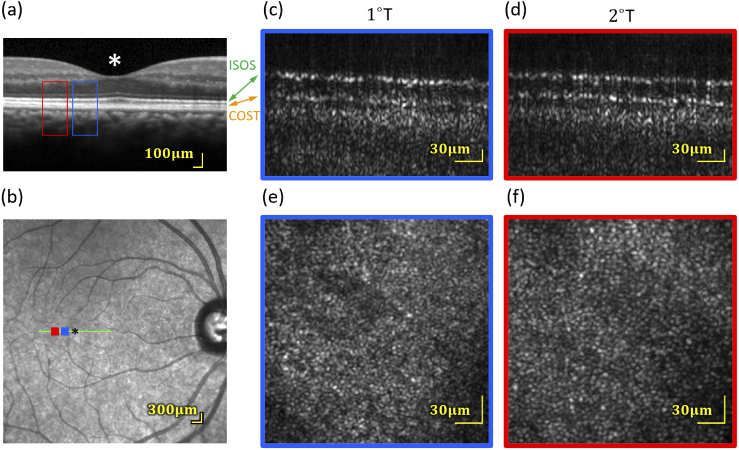
Fig. 5.
(a and b) Spectralis OCT and SLO scans indicating the areas that were imaged with the AO-FF-SS-OCT. (c and d) amplitude B-scans (averaged over four lateral B-scans in a single volume) from 1° and 2° in one subject, from volumes acquired at 200 Hz. Only the outer retina is shown. At both eccentricities, two bright bands are visible, originating from the IS/OS and COST. Each has the characteristic periodic pattern of the photoreceptor mosaic. The dark region separating them is the cone OS, visibly longer at 1° than 2°. (e and f) Corresponding en face projections through the cones (average of 40 motion-corrected volumes). Analysis of the IS/OS and COST band SNRs implies a sensitivity to light-evoked deformation of 7.3 nm.

