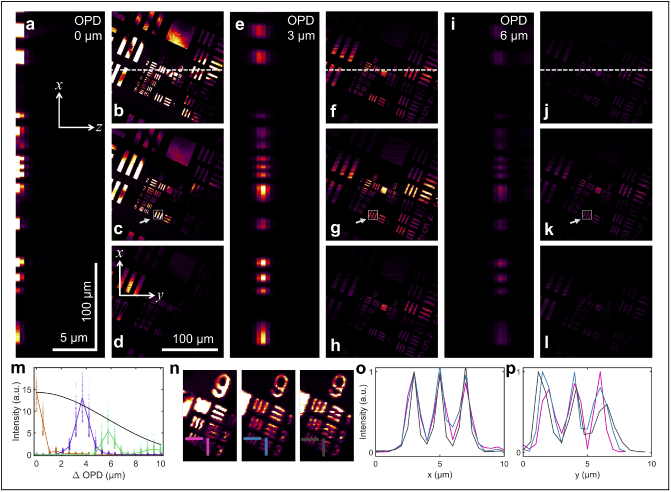
Fig. 2.
(a) Cross section of a Snapshot OCM volume of an USAF target placed at 0 OPD in the - plane through the pixel in (along the white dotted line in (b)). (b-d) Corresponding en face images from a Snapshot OCM volume of an USAF target placed at 0 OPD at the three consecutive depths of maximum intensity in the cross-sectional images shown in (a). (e) Cross-section of a Snapshot OCM volume of an USAF target placed at an OPD of approximately 3 µm through the pixel in (along the white dotted line in (f)). (f-h) Corresponding en face images from a Snapshot OCM volume of an USAF target placed at OPD of approximately 3 µm at the three consecutive depths of maximum intensity in the cross-sectional images shown in (e). (i) Cross-section of a Snapshot OCM volume of an USAF target placed at an OPD of approximately 6 µm through the pixel in (along the white dotted line in (j)). The legend for the axes and the scale bars also correspond to the other cross sectional images in (a) and (e). (j-l) Corresponding en face images from a Snapshot OCM volume of an USAF target placed at OPD of approximately 6 µm at the three consecutive depths of maximum intensity in the cross-section images shown in (i). The legend for the axes and the scale bars also correspond to the other en face images in (b-d) and (f-h). (m) Graph that depicts the variation of image intensity () at different locations for region of interest indicated in (c), (g), and (k) from three Snapshot OCM volumes of the USAF targets at different OPDs. The solid line indicates the median intensity at each depth while the points show the distribution of all the raw values. The colors gold, purple, and green correspond to OPDs of 0, 3, and 6 µm, respectively. The black line is the theoretical roll-off of sensitivity with depth [28] normalized to the maximum intensity at 0 OPD. (n) Zoomed-in and intensity-normalized en face images of the smallest bars in the USAF target at the same locations in as that of (c), (g), and (k). The horizontal and vertical lines show the slices along which the graphs in (o) and (p) are plotted to calculate the transverse resolution. (o) The intensity of the structures along the horizontal lines in (n), where the color of the plot corresponds to the color of the corresponding line, i.e. pink, blue, and gray correspond to OPDs of 0, 3, and 6 µm, respectively. (p) The intensity of the structures along the vertical lines in (n), where the color of the plot corresponds to the color of the corresponding line, i.e. pink, blue, and gray correspond to OPDs of 0, 3, and 6 µm, respectively.

