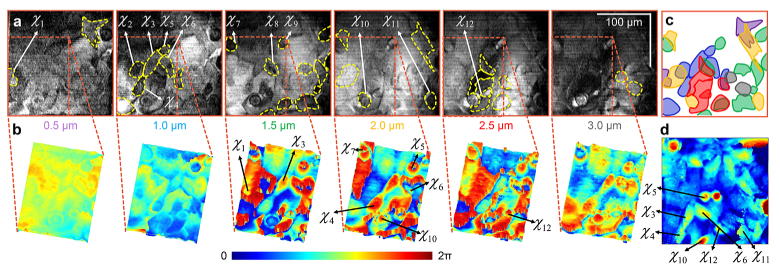
Fig. 3.
(a) Stack of the magnitude of en face Snapshot OCM images of mouse mesangial cells cultured densely on a flat surface at contiguous series of depths. The exact axial locations in microns are indicated below each frame. The dotted yellow lines highlight a few structures that were manually annotated based on the contrast due to changes in intensity at each depth. Particular structures of interest are labelled - at different depths. Scale bar: 100 µm. (b) Surface plot of the phase of the Snapshot OCM images for the same depths corresponding to a zoomed-in region in the intensity images in (a). The phase profiles of the structures of interest in (a) are marked with the same labels. The intensity and phase images of the cells in (a) and (b) were median filtered with a 52 and a 44 window, respectively, to enhance visualization. (c) An overlay of the different annotated structures in (a). The color of each structure corresponds to the color of the font that indicates the axial locations of frames in (a). (d) Phase of a traditional FF-OCM image of the same sample acquired with an independent camera. The structures of interest are marked with the same labels in (a) and (b).

