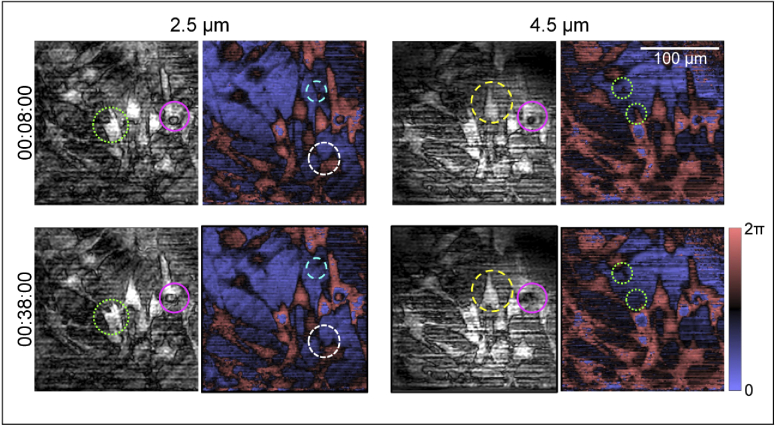
Fig. 4.
Magnitude (grayscale) and phase (blue-red color map) of the scattered field from NIH 3T3 fibroblasts imaged using Snapshot OCM, displayed at depths 2.5 µm and 4.5 µm from 0 OPD at two instances in time 30 minutes apart. A 33-pixel computational darkfield filter was added to generate the magnitude images to improve their contrast. Paclitaxel was added at time 00:00:30 at a final concentration of 3 mg/mL. Differences to the cellular morphology between the two instances at each depth are highlighted in the magnitude images, and differences to the overall network are highlighted in the phase images. The different colors (green, pink, cyan, yellow, and white) are indicative of different cells/spatial locations of interest. A computational 33 pixel dark-field filter was added to the transverse Fourier domain at every depth to generate images of the magnitude of the scattered field. Scale bar: 100 µm.

