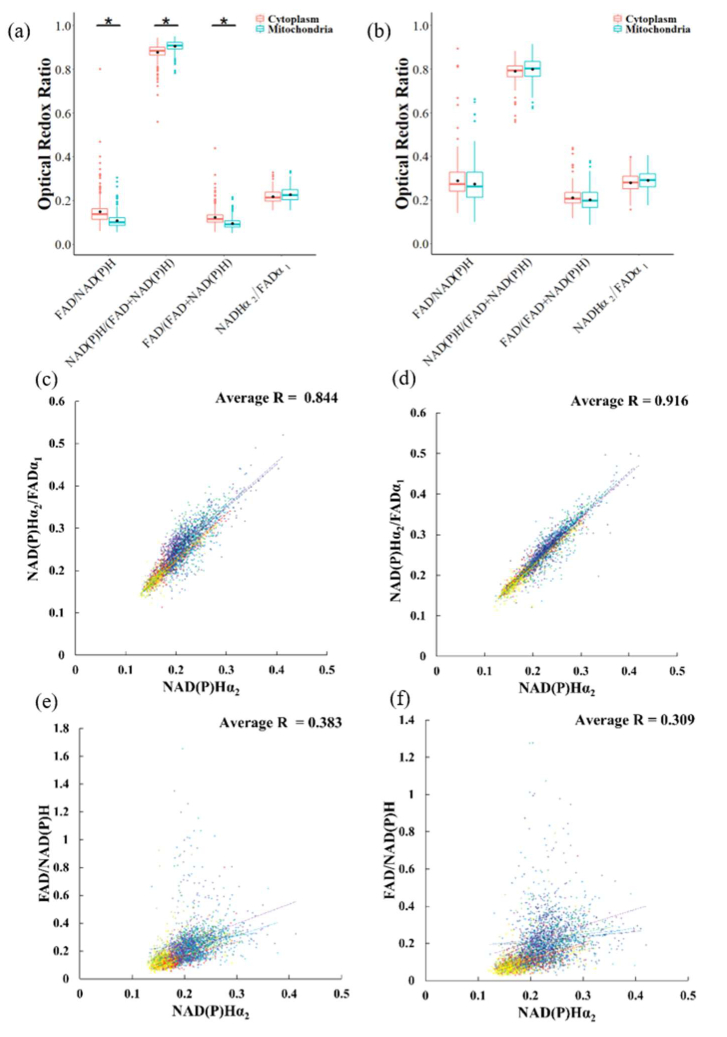
Fig. 5.
Comparison of redox ratios between mitochondria and cytoplasm pixels of T cells. Redox ratios of mitochondria and cytoplasm pixels of (a) activated control T cells and (b) quiescent control T cells. (c) Correlation between NAD(P)H α2 and FLIRR in the cytoplasm and (d) in the mitochondria (e) Correlation between NAD(P)H α2 and FAD/NAD(P)H in the cytoplasm and (f) in the mitochondria. In (c-f) each color represents a T cell group. (dark red = activated control, red = activated rotenone + antimycin A, orange = activated 2DG, yellow = activated TOFA, light green = activated BPTES, green = quiescent control, light blue = quiescent rotenone + antimycin A, blue = quiescent 2DG, dark blue = quiescent TOFA, purple = quiescent BPTES).

