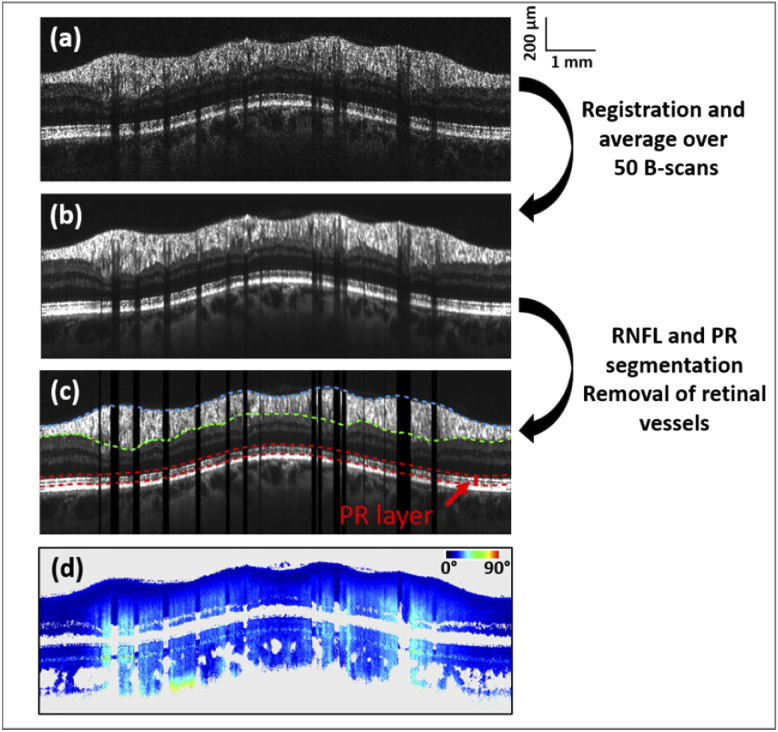
Fig. 1.
Representative circular B-scans associated with the analysis of RNFL birefringence. Averaged intensity scan (b) is obtained by registration and averaging of 50 individual B-scans (a). RNFL thickness is obtained from the segmented upper (blue) and lower (green) boundaries of the RNFL layer as shown in (c). After segmentation of the RPE, the retardation values at the photoreceptor layer (boundaries in red in (c)) are obtained from the averaged retardation scan (d) for the RNFL birefringence calculation using the quotient method. In the case of the linear regression method, the linear fit at each A-scan location, whose slope corresponds to the RNFL birefringence, also uses the averaged retardation scan (d).

