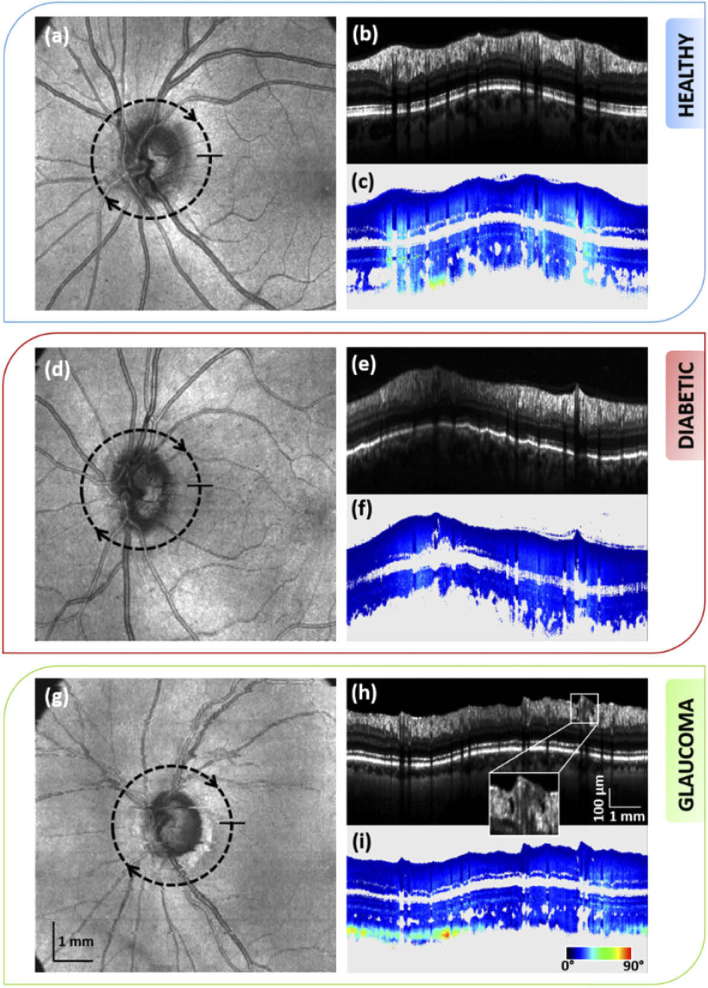
Fig. 2.
Comparison between the intensity and retardation averaged circular scan of the left eye of a healthy subject (b)-(c), a diabetic patient (e)-(f) and a glaucoma patient (h)-(i). Lower retardation is observed in the RNFL of the diseased retina as compared to the healthy one. Location of the circular scan is indicated on the corresponding en-face intensity maps, (a), (d) and (g). The framed area in the averaged intensity scan of the glaucoma subject (h) point out holes in the RNFL of this patient.

