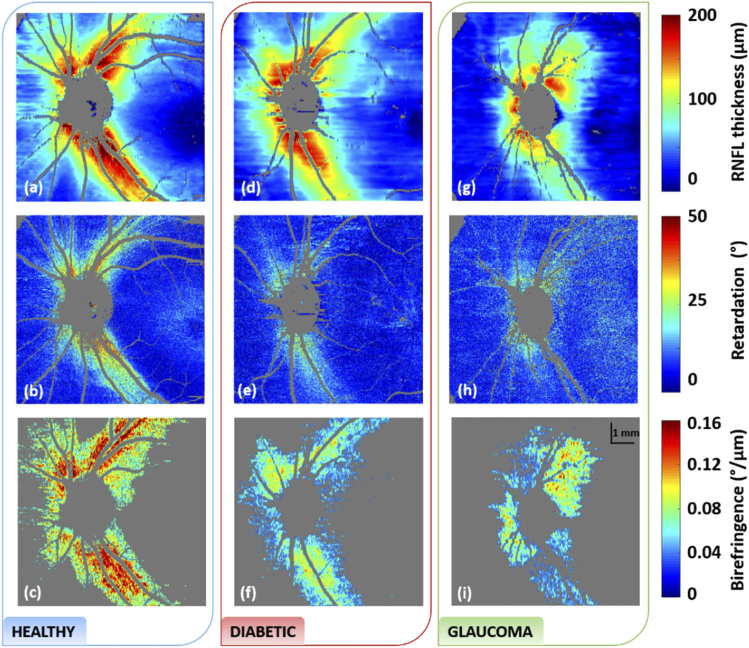
Fig. 3.
RNFL thickness (a,d,g), retardation (b, e, h) and birefringence (c, f, i) maps of the healthy, diabetic and glaucoma subjects shown in Fig. 2. Reduced retardation is seen in both the diabetic and glaucoma cases as compared to the healthy one. Reduced birefringence is particularly seen in the diabetic case, even in areas of thick NFL. A RNFL thickness threshold of 75 µm was used for visualization of the birefringence maps.

