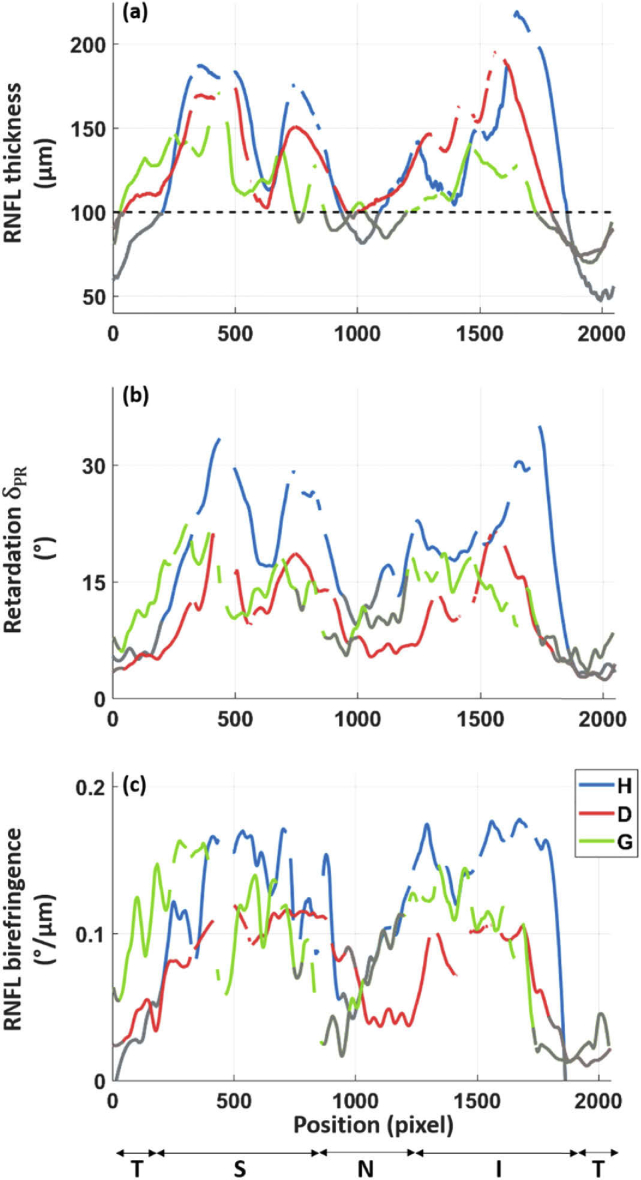
Fig. 4.
Graphs of the RNFL thickness (a), retardation (b) and birefringence (c) along a circle around the ONH for the healthy (H), diabetic (D) and glaucoma (G) subjects shown in Fig. 2. A sliding average over 10 A-scans was applied for all plots. The retardation and birefringence data were smoothen based on a local regression method. The gaps in the plots indicate vessel positions. The known double hump patterns of the RNFL are recognizable in the different graphs. The retardation and birefringence plots of the diabetic patient appear clearly lower compared to the ones of the healthy subject. While all values along the circumpapillary scan are shown here, only locations of RNFL thickness > 100 µm are used for the quantitative analysis. The values at RNFL thickness < 100 µm are displayed in gray. (T: temporal, S: superior, N: nasal, I: inferior, defined according to the GDx-VCC quadrant division).

