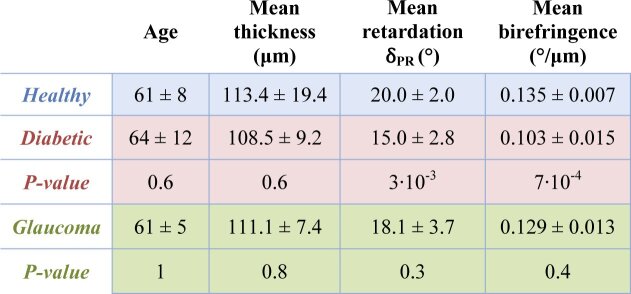
Table 2. Averaged RNFL thickness, retardation and birefringence values for the set of heathy volunteers (n = 7), diabetic (n = 7) and glaucoma patients (n = 6). The thickness values are calculated from the entire circumpapillary scan while the retardation and birefringence values only consider areas of RNFL thickness > 100 µm (excluding, for example, areas of possible RNFL thinning in patients). For each parameter, the p-values of the t-test between healthy and diabetic and healthy and glaucoma are given. A statistically significantly reduced birefringence is seen in the RNFL of diabetic patients as compared to the heathy subjects (p=7·10−4).

|
