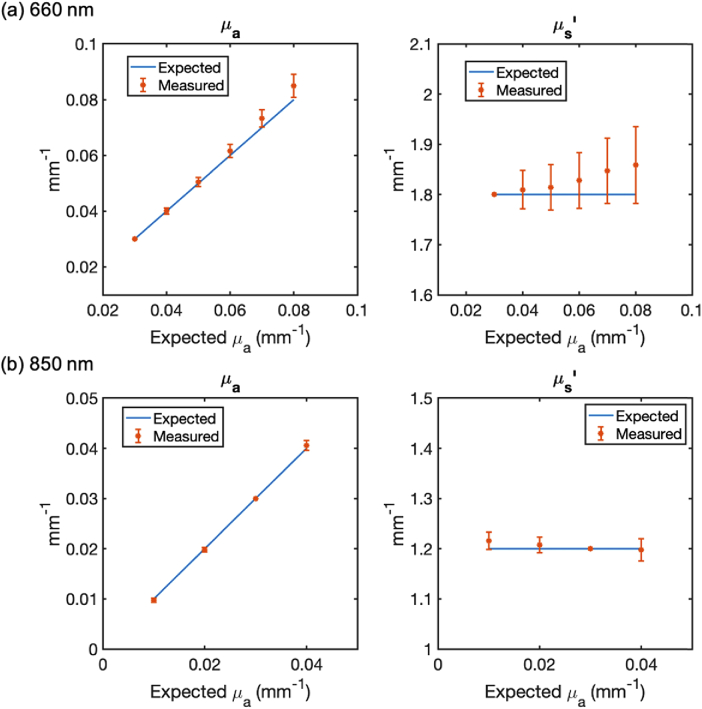
Fig. 3.
Recovered optical properties of the tissue phantoms. The measured average µa and µs’ are plotted against the expected values for (a) 660 nm and (b) 850 nm illuminations. The error bar indicates the standard deviation among pixels. In all cases, the discrepancy between the measured and expected values were below 6%.

