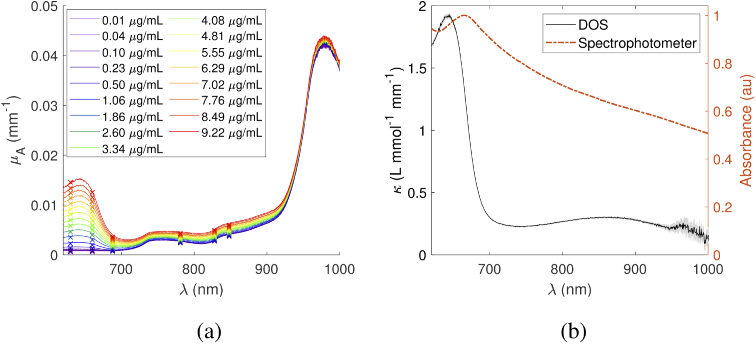
Fig. 5.
(a) Absorption spectra for increasing concentrations of Hz. (b) Measured molar absorption spectrum for Hz, overlaid with attenuation spectrum of Hz in DI water. The shaded uncertainty region represents the interquartile range of the normalized difference between absorption spectra and their fits.

