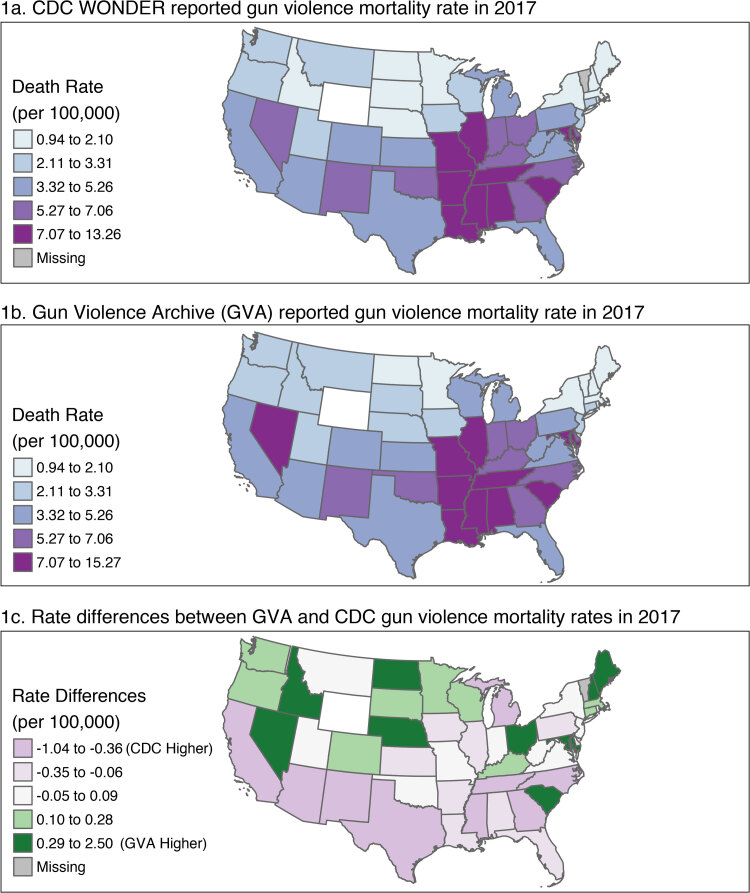
Spatial distribution of unadjusted death rate per 100,000 population of deaths from gun violence across the contiguous United States, by state, in 2017 in 2 data sets: the Centers for Disease Control and Prevention (CDC) Wide-ranging OnLine Data for Epidemiologic Research (WONDER) database (1) (panel 1a) and the Gun Violence Archive (GVA) (2) (panel 1b). Panel 1c shows the rate differences between the 2 data sets. Population data are from the US Census Bureau (3).

An official website of the United States government
Here's how you know
Official websites use .gov
A
.gov website belongs to an official
government organization in the United States.
Secure .gov websites use HTTPS
A lock (
) or https:// means you've safely
connected to the .gov website. Share sensitive
information only on official, secure websites.
