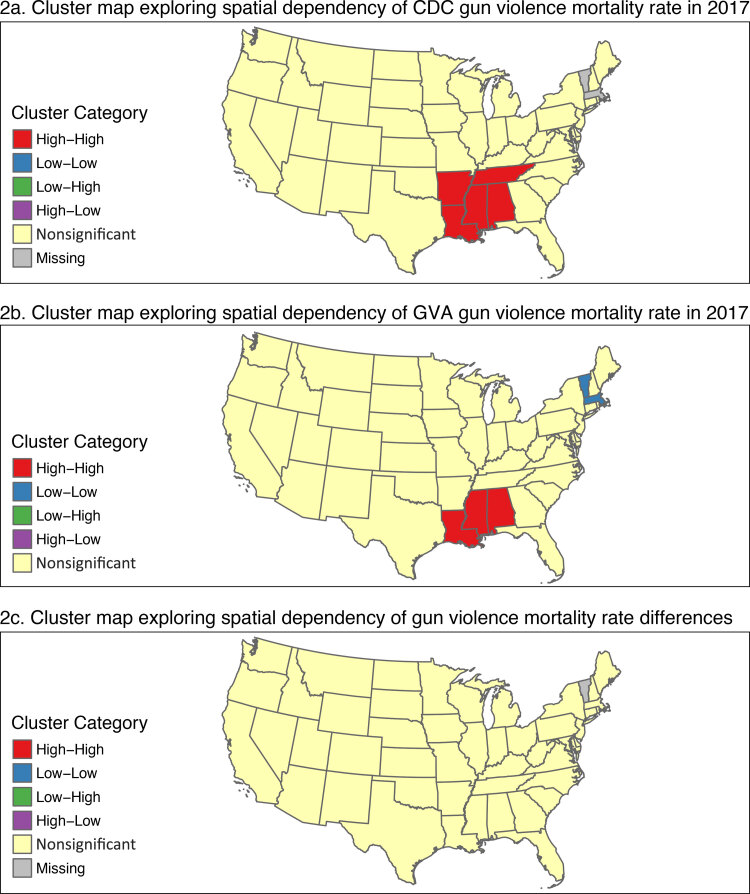
Cluster maps of the spatial dependency of gun violence mortality rates across the contiguous United States, by state, in 2017 in 2 data sets: the Centers for Disease Control and Prevention (CDC) Wide-ranging OnLine Data for Epidemiologic Research (WONDER) database (1) (panel 2a) and the Gun Violence Archive (GVA) (2) (panel 2b). Panel 2c shows the rate differences between the 2 data sets. Population data are from the US Census Bureau (3). Local Moran’s I (4) was used to calculate mortality rate differences between the states. States with missing data were suppressed because of small numbers in CDC WONDER.

An official website of the United States government
Here's how you know
Official websites use .gov
A
.gov website belongs to an official
government organization in the United States.
Secure .gov websites use HTTPS
A lock (
) or https:// means you've safely
connected to the .gov website. Share sensitive
information only on official, secure websites.
