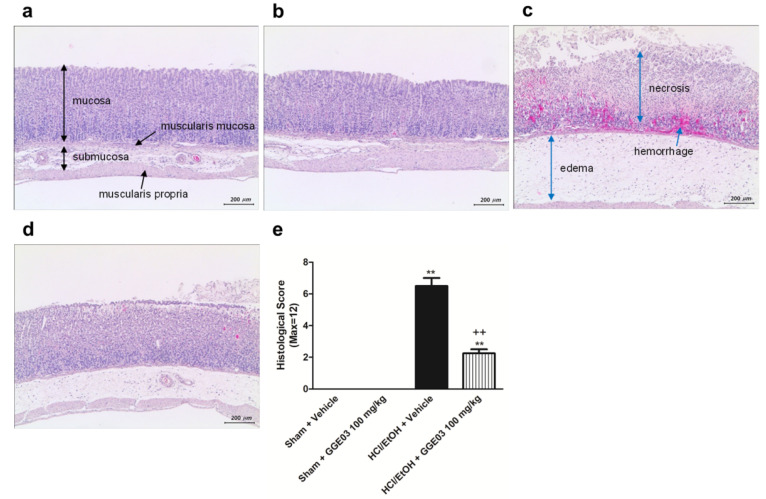
Figure 2.
Effects of GGE03 on histological analysis of the stomach lesion in rats exposed to EtOH/HCl (n = 4–6). (a) Sham + Vehicle group; (b) Sham + GGE03 100 mg/kg group; (c) EtOH/HCl + Vehicle group; (d) EtOH/HCl + GGE03 100 mg/kg group; (e) histological score. Data are expressed as the mean ± S.E.M. Compared with Sham + Vehicle group: ** p < 0.01; compared with EtOH/HCl + Vehicle group: ++ p < 0.01.

