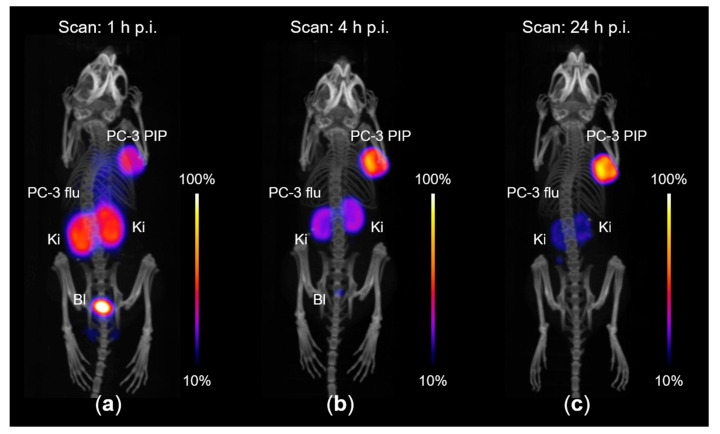
Figure 8.
PET/CT images acquired with PC-3 PIP/flu tumor-bearing nude mice after intravenous injection of [44Sc]Sc-PSMA-ALB-02 (~5 MBq, 1 nmol per mouse). The PET/CT images are shown as maximum intensity projections (MIPs) with the scale adapted for each time point to make tumors and kidneys visible. (a) PET/CT scan obtained 1 h p.i. of the radioligand; (b) PET/CT scan obtained 4 h p.i. of the radioligand; (c) PET/CT scan obtained 24 h p.i. of the radioligand. PC-3 PIP = PSMA-positive tumor xenograft on the right shoulder; PC-3 flu = PSMA-negative tumor xenograft on the left shoulder; Ki = kidney; Bl = bladder.

