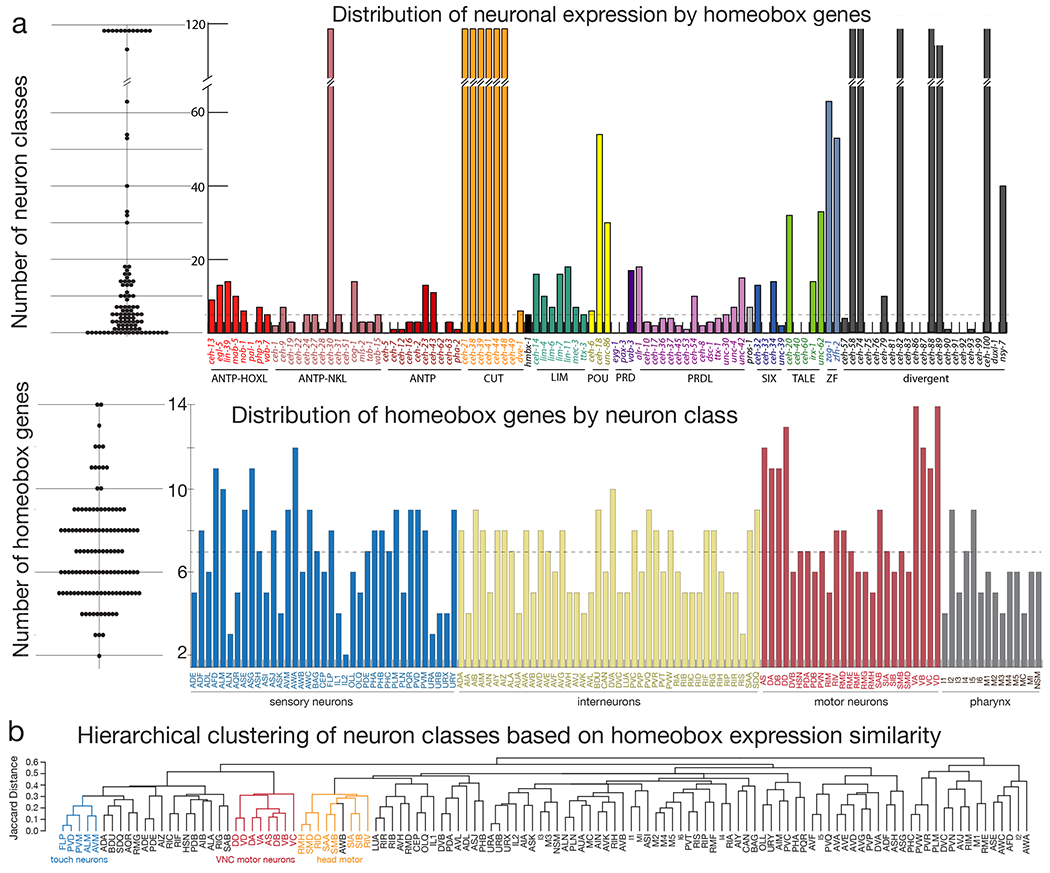
Figure 2: Summary of homeobox gene expression patterns across the nervous system and similarity of neuron classes based on homeobox gene codes.

(a) Upper panel: Number of neuron classes where each homeobox gene is expressed Left: Dotplot distribution where each dot represents a homeobox gene, and the value associated with the dot represents the number of neuron classes in which this homeobox gene is expressed in. Right: Histogram showing the number of neuron classes in which each homeobox gene is expressed in. Organized and colored by homeobox gene subfamily and shared protein domains. The dashed line at 5 neuron classes is the median number of neuron classes in which each homeobox gene is expressed. Lower panel: Number of homeobox genes expressed in each neuron class Left: Dotplot distribution where each dot represents a neuron, and associated value represents the number of homeobox genes expressed in this neuron. Right: Histogram displaying the number of homeobox genes expressed in each neuron class excluding the panneuronal homeobox genes and ordered by the neuron type (sensory, motor, inter, and pharyngeal). Dashed line at 7 homeobox genes is the median number of genes per neuron class.
(b) Dendrogram ordering neuron classes based on the similarity of their homeobox gene code. Some examples of functionally related neuron groups are shaded.
