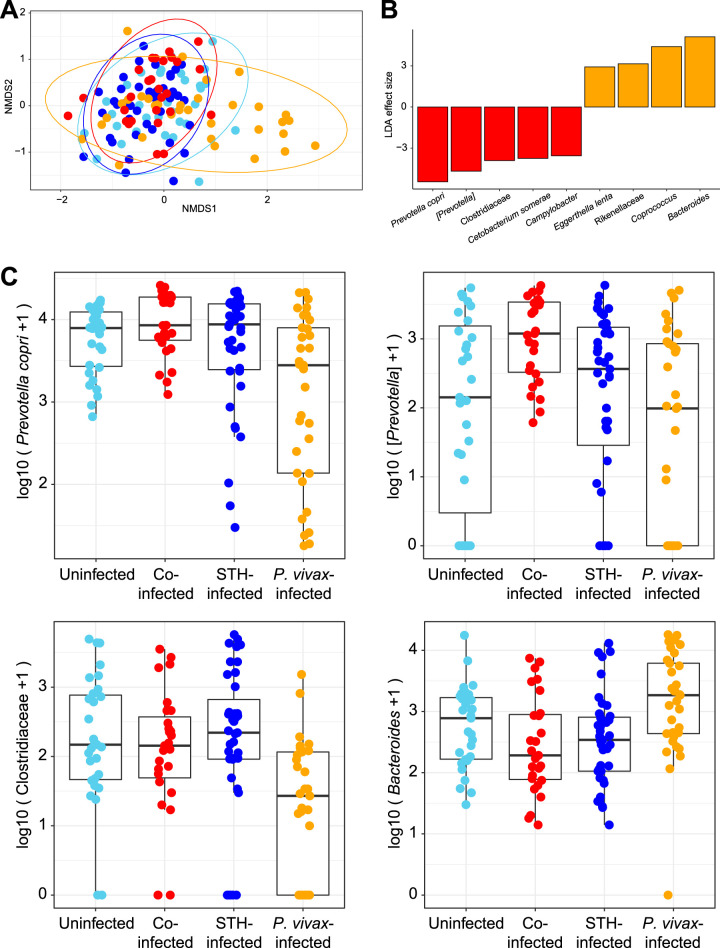
FIG 4.
Effects of STH coinfection on the microbiota of P. vivax-infected patients. (A) NMDS plot based on Jaccard distances between stool microbiota samples (based on 16S rRNA gene sequencing), colored according to STH-P. vivax infection status. Some individuals with P. vivax infections only (orange) had a distinct microbiota and clustered separately along the first axis. (B) LDA effect sizes calculated using LEFSe (58) are shown, comparing samples from individuals infected with P. vivax alone with samples from those coinfected with P. vivax and STH. Microbes that were significantly (P < 0.01) elevated in individuals infected with P. vivax only are shown in orange, and microbes that were significantly elevated in individuals coinfected with P. vivax and STH are shown in red. This comparison was made based on the visual differentiation of these groups in panel A and the comparability of these two hospital-based groups. (C) Box plots for the three top microbes enriched in samples from coinfected individuals and the top microbe enriched in samples from P. vivax-infected individuals.

