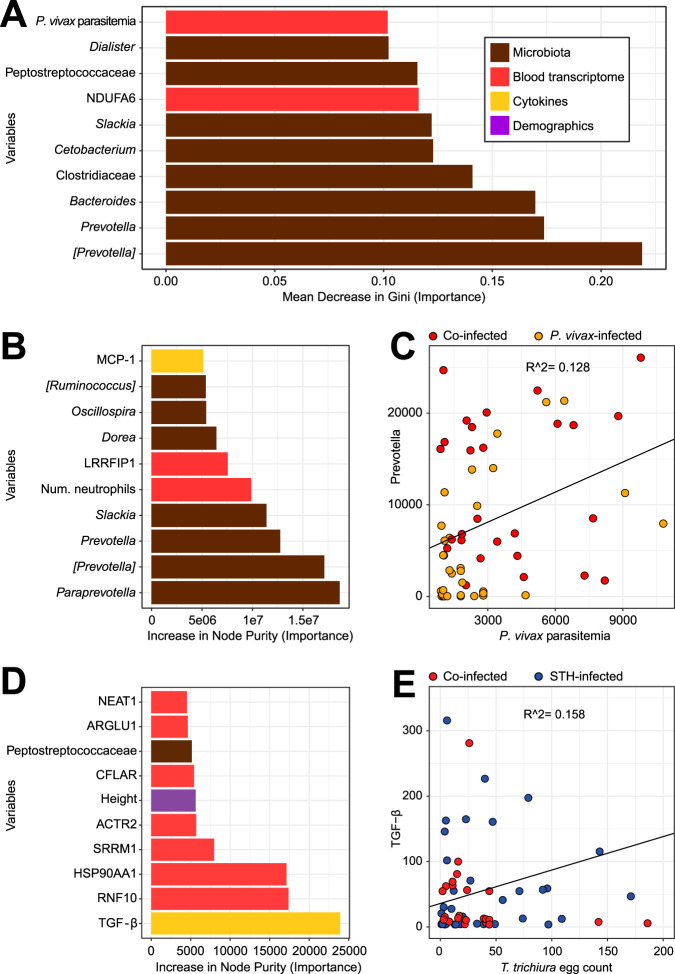
FIG 6.
Integrative analysis of heterogeneous data sets using random forest models to identify the strongest predictors of coinfection and parasite burden. (A) The random forest model selected eight microbes (brown) in the top 10 predictors of whether a P. vivax-infected child is also infected with STH. Bars represent the mean decrease in Gini when a variable is removed from the model; a larger decrease means that the variable is more different between individuals infected with P. vivax only and those with both P. vivax and STH infections. Bars are color-coded based on the type of variable: microbes measured by 16S rRNA gene sequencing are shown in brown, genes measured by RNA-Seq in red, cytokines in yellow, and demographic variables from a questionnaire in purple. The model included 4,046 variables: 38 microbial genera, 3,907 genes, 85 measurements from blood tests, including CBC w/diff and cytokine levels, and 16 variables from the demographic questionnaire. Of the 10 variables shown, all were higher in the coinfected group, except for NDUFA6 and Bacteroides, which were higher in the P. vivax-only group. However, the strongest predictors of whether an individual is infected with P. vivax or not (see Fig. S8A) are found in the data from clinical bloodwork and cytokine panels. (B) The random forest model selected seven microbes in the top 10 predictors of P. vivax parasitemia. In this continuous-outcome model, the increase in node purity represents the importance of the variable to the model; higher numbers mean that the variable is more important for predicting P. vivax parasitemia. The model included the same variables as those in panel A, except that the group (the response variable in panel A) was removed and P. vivax parasitemia was made into a response rather than a predictor. (C) To examine one of these important variables, we created a scatter plot, which shows that Prevotella is correlated with P. vivax parasitemia (r2 = 0.13; P = 0.005 [among those infected with P. vivax]). Results for samples from children infected with P. vivax only are shown in orange, and those from children coinfected with STH are shown in red. (D) The random forest model selected TGF-β as the top predictor of the T. trichiura egg count. Other variables that are predictive of egg burden include several genes (from RNA-Seq results), the child’s height, and one microbe. The model included the same variables as those in panel A, except that the T. trichiura egg count was made into a response rather than a predictor. (E) TGF-β is correlated with the T. trichiura egg count (r2 = 0.16; P = 0.002 [among those infected with T. trichiura]). Results for samples from children infected with STH only are shown in blue, and those from children coinfected with P. vivax are shown in red.

