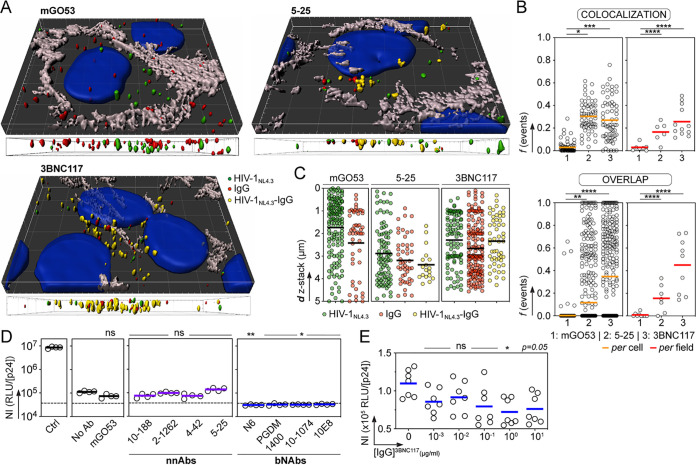
FIG 3.
bNAbs neutralize HIV-1 transcytosed through the BBB endothelium. (A) Representative images from the 3D reconstruction of the confocal microscopy experiments on hCMEC/D3 cell monolayers with GFP-labeled HIV-1 (green) in the presence of mGO53, 5-25 and 3BNC117 antibodies (red). Yellow objects represent HIV-1 virions collocating with antibodies. Nuclei and intercellular junctions were stained with DAPI (blue) and anti-VE cadherin antibody (gray), respectively. Side views of the 3D confocal microscopy pictures across the depth of endothelial cells are shown below each image. (B) Graphs comparing colocalization using Pearson coefficient (r) and percentage of overlap between fluorescent HIV-1 viruses and mGO53, 5-25, and 3BNC117 antibodies, per cell and per field. Values of the Pearson coefficient and frequency of overlapping virus-IgG objects were compared between groups using Dunn's multiple-comparison and Mann-Whitney tests, respectively. *, P < 0.05; **, P < 0.01; ***, P < 0.001; **** P ≤ 0.0001. (C) Dot plots show the number of fluorescent objects corresponding to HIV-1 NL4.3 virus alone (green) or antibodies IgG alone (red) or virus-antibody complexes (HIVNL4.3-IgG; yellow) according to the distance across the z-stack depth. Quantification was made using three representative 4- to 5-μm z-stack acquisitions. (D) Dot plots comparing the normalized infectivity (NI; calculated as RLU/p24 concentration [nanograms per milliliter) of HIV-1 virions transcytosed across the BBB in the absence (No Ab) or presence of a non-HIV-1 isotype control (mGO53), HIV-1 gp160 NnAbs, and bNAbs. Ctrl, HIV-1 applied to Transwell membranes without endothelial cells. Each replicate per condition (n = 4) was tested in triplicate for infectivity. Dotted lines indicate basal levels of luminescence given by TZM-bl cells alone. (E) Same as for panel D but with various concentrations of 3BNC117 IgG antibodies. Each replicate (n = 3 or 4) per independent experiment (n = 2) was tested in triplicate for infectivity. Groups in panels D and E were compared to no-Ab controls using Dunn's multiple-comparison test. *, P < 0.05; ** P < 0.01; ns, non significant.

