FIG 2.
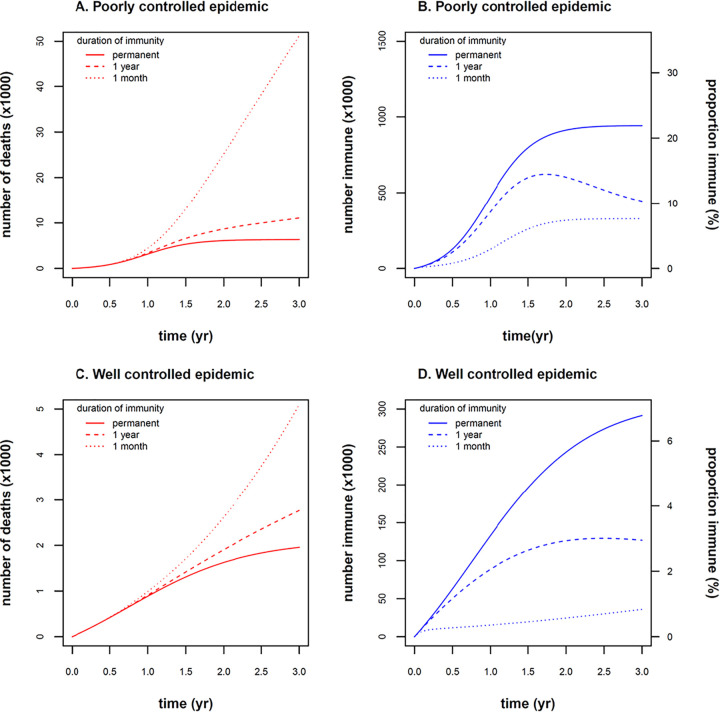
Model projections over 3-year time frame (prior to availability of a vaccine). Two scenarios were modeled: (i) poorly controlled epidemic (θ = 0.45) (A and B) and (ii) well-controlled epidemic (θ = 0.41) (C and D). (A) The number of deaths was sensitive to model assumptions about waning immunity. If immunity waned rapidly (dotted line, 1/γ = 1 month), deaths increased exponentially (51,000 deaths after 3 years). If immunity waned more slowly (dashed line, 1/γ = 1 year), deaths decreased (11,000 deaths after 3 years) but still remained 1.7-fold higher compared to a scenario with permanent immunity (6,300 deaths after 3 years, solid line, γ = 0). (B) The number and proportion of immune individuals rose to 22% of the population after 3 years, assuming permanent immunity (solid line, γ = 0), explaining the protection from new cases and deaths (“herd immunity”) seen in panel A. The proportion of immune individuals was reduced after 3 years to 10% and 7.6%, assuming slowly waning immunity (dashed line, 1/γ = 1 year), and rapidly waning immunity (dotted line, 1/γ = 1 month), respectively. (C) With a well-controlled epidemic, the number of deaths was reduced by an order of magnitude relative to the poorly controlled epidemic seen in panel A (5,100, 2,800, and 2,000 deaths at 3 years for 1/γ = 1 month, 1/γ = 1 year, and γ = 0, respectively). The effect of waning immunity was still numerically important but not as marked as in panel A. (D) The proportion of immune individuals rose to 6.8%, 2.9%, and 0.84% of the population after 3 years due to the smaller number of infections in the well-controlled epidemic. Low levels of “herd immunity” under this scenario explain the blunted sensitivity of deaths to assumptions of waning immunity in panel C.

