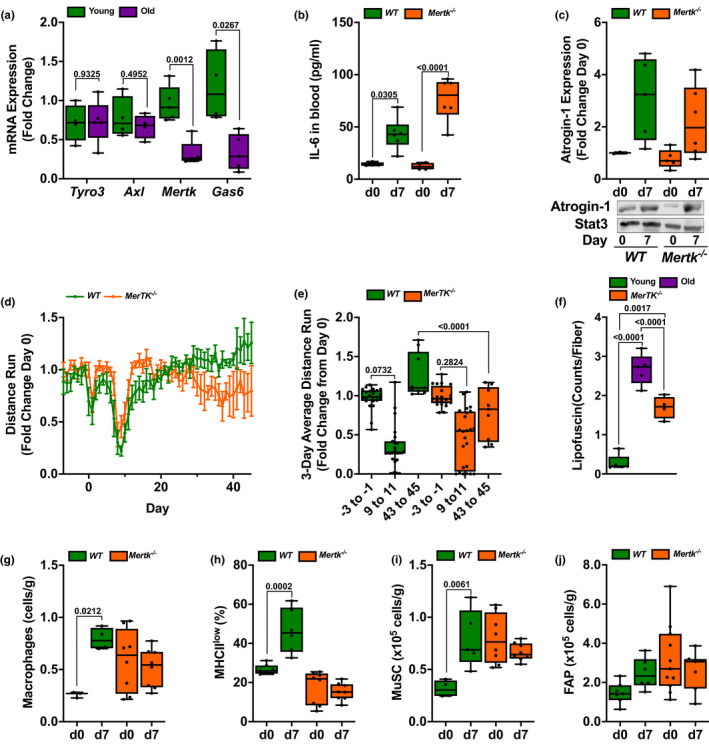
Figure 6.

Mertk is necessary for recovery of skeletal muscle function after influenza A‐induced pneumonia. (a) Skeletal muscle macrophages were isolated from naïve young (4 months: green bars) and old (20–24 months: purple bars) mice, and RNA was analyzed for TAM family members via real‐time qPCR with SYBR Green (n = 5 mice). (b) Young (4 months old: orange bars) Mertk −/− mice and age‐matched wild‐type control mice (green bars) were infected with influenza A virus (IAV) (25 pfu) and harvested before the infection (day 0) and 7 days after the infection. IL‐6 was measured by ELISA in the serum (n = 4–6 mice). (c) Young (4 months old: orange bars) Mertk −/− mice and age‐matched wild‐type control mice (green bars) were infected with IAV (25 pfu) and harvested before the infection (day 0) and 7 days after the infection. Quantification (top panel) and representative Western blot (bottom panel) of atrogin‐1 expression in the mouse tibialis anterior muscle. GAPDH was used as a loading control (n = 3–6 mice). (d) Prior to being infected with IAV, young (4 months) Mertk −/− mice (orange lines) and age‐matched wild‐type control mice (green lines) were exposed to voluntary wheel running for 14 days. They were then infected with 25 pfu of IAV, and voluntary wheel running was recorded for 50 days. The 8 p.m. to 6 a.m. average wheel rotation/mouse, corrected to the initial 10‐day average control, is shown (n = 15 mice per group). Graph shows distance run with means ± SD (e) Mice were treated as in (d). The 3‐day average voluntary wheel running per cage is shown for days −3 to −1 prior to IAV, days 9–11 post‐infection, and days 43 to 45 post‐infection (n = 15 mice per group). (f) Graph depicting number of lipofuscin granules per fiber cross section counted manually in Image J. Five mice per group (an average of 3 fields of view per mouse). (g) Young (4 months old, orange bars) Mertk −/− mice and age‐matched wild‐type control mice (green bars) were infected with IAV (25 pfu) and harvested before the infection (day 0) and 7 days after the infection. Skeletal muscle macrophages were enumerated using flow cytometry (n = 4–8 mice). Values are expressed per gram of tissue. (h) Young (4 months old, orange bars) Mertk −/− mice and age‐matched wild‐type control mice (green bars) were infected with IAV (25 pfu) and harvested before the infection (day 0) and 7 days after the infection. MHCIIlow skeletal muscle macrophages were enumerated using flow cytometry (n = 4–8 mice). Values are expressed as a percent of total macrophages. (i) Young (4 months old, orange bars) Mertk −/− mice and age‐matched wild‐type control mice (green bars) were infected with IAV (25 pfu) and harvested before the infection (day 0) and 7 days after the infection. Skeletal muscle satellite cells (MuSCs) were enumerated using flow cytometry (n = 4–8 mice). Values are expressed per gram of tissue. (j) Young (4 months old, orange bars) Mertk −/− mice and age‐matched wild‐type control mice (green bars) were infected with IAV (25 pfu) and harvested before the infection (day 0) and 7 days after the infection. Skeletal muscle fibroadipogenic progenitor (FAP) cells were enumerated using flow cytometry (n = 4–8 mice). Values are expressed per gram of tissue. For all experiments, a two‐way ANOVA with Tukey's post hoc corrections for comparison with more than three groups was used to show statistical differences. Box plot center lines are median, box limits are upper and lower quartiles, whiskers are minimal and maximal values, and p values are shown on the graph. Each dot represents an individual animal
