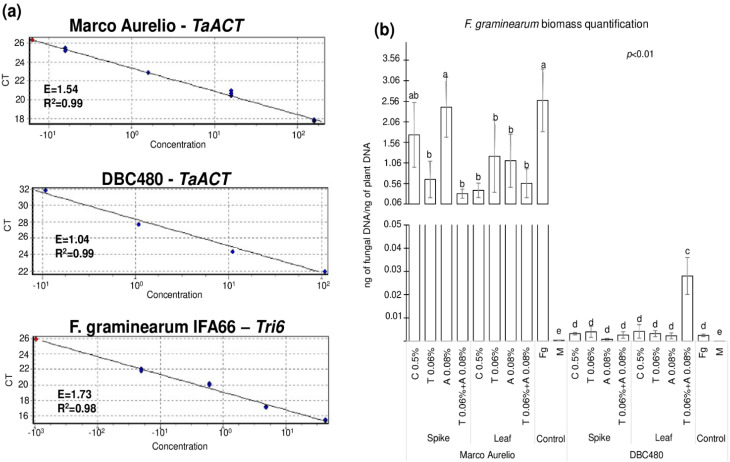
Figure 8.
(a) Standard curves of the TaACT and Tri6 genes for the Real-Time qPCR quantification of the fungal biomass. (b) F. graminearum biomass quantification expressed as ng of fungal DNA/ng of plant DNA from Marco Aurelio and DBC480 spikes recorded after treating the plants at the spike or flag leaf level with Chitosan at 0.5% (C 0.5%), tebuconazole at 0.06% (T 0.06%), azoxystrobin at 0.08% (A 0.08%), the mixture of tebuconazole at 0.06% and azoxystrobin at 0.08% (T 0.06% + A 0.08%) prior to F. graminearum inoculation, solely F. graminearum inoculated (Fg) and Mock (M) controls were included. The data represent averages and standard errors from four technical replicates derived from three biological replicates for each variable (wheat genotype × compound × mode of application). Different letters (a, b, c, d, e) into the subfigureb refer to the statistical analysis performed using three-way analysis of variance (ANOVA) with the Tukey test at a confidence level of 0.99 and p < 0.01.

