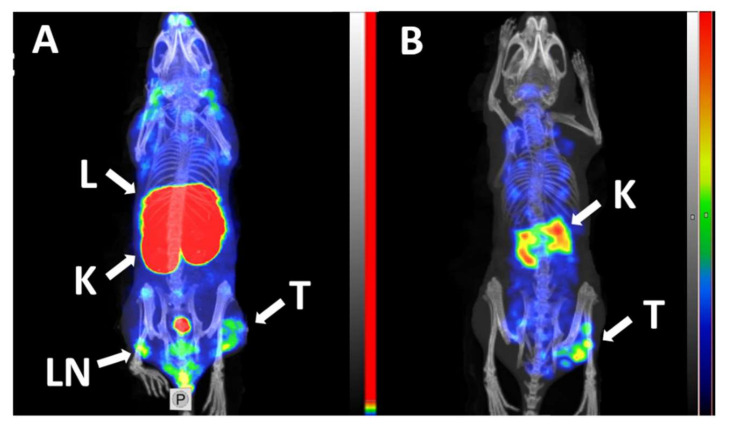
Figure 6.
Micro-Single-Photon Emission Computed Tomography/Computed Tomography (microSPECT/CT) imaging of EpCAM expression in BALB/C nu/nu mice bearing EpCAM-positive MDA-MB-468 xenografts at 6 h pi using [99mTc]Tc(CO)3-Ec1 (A) and [125I]I-PIB-Ec (B). Arrows indicate: T—tumor, K—kidneys, L—liver, LN—lymph node. The scale in panel A was adjusted to the first red pixel in the tumor.

