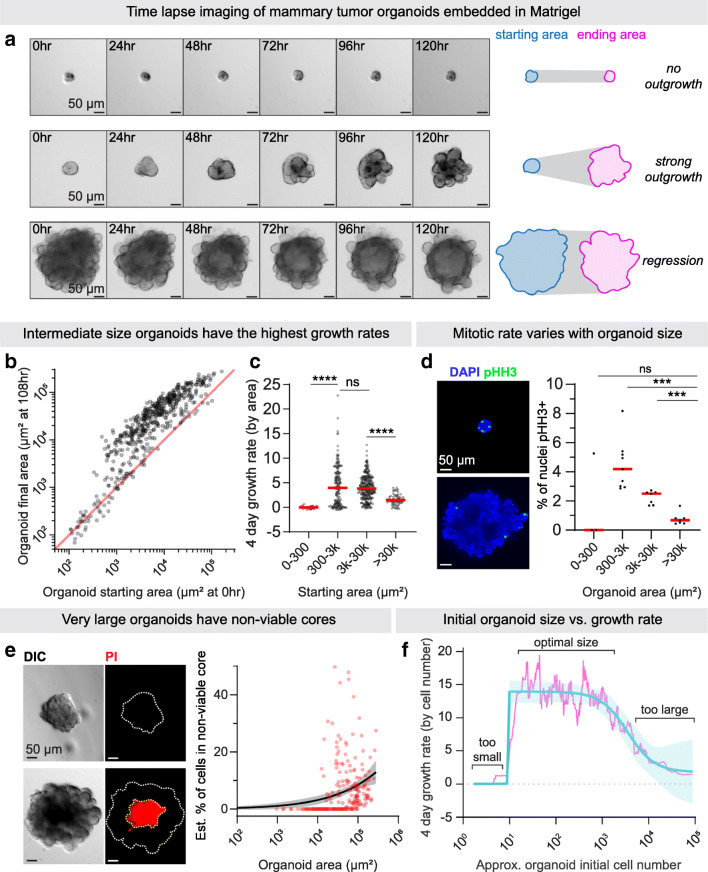
Fig. 1.
Maximal organoid growth occurs within an intermediate size range which promotes proliferation and minimizes cell death. a Time lapse imaging of MMTV-PyMT organoids in 3D Matrigel. Right, summary of growth as change in area. See also Movie S1. b Organoid initial area and final area (after 4 days of time lapse imaging in 3D Matrigel) were measured to estimate growth over time. n = 522 organoids from 8 mice. Red line = fold change of 1 (no growth). c Organoid area growth rate ([final area-initial area]/initial area) from 4 days of time-lapse imaging in 3D Matrigel binned by initial organoid area. n = 8 mice, 522 organoids. P values = unpaired t-tests. d Mitotic rate assessed by phospho-Histone H3 immunofluorescence in organoids of varying sizes in 3D Matrigel. Each dot represents the % of cells pHH3+ in organoids derived from one biological replicate, n = 349 organoids, n = 14 to 65 organoids per mouse. Red line = median. P values = unpaired t-tests. e Propidium iodide (PI) staining of non-viable cells in organoids of varying sizes in 3D Matrigel. The PI+ core area was measured and converted to a volume to estimate the % of cells in the non-viable core region, relative to the total organoid volume. Each dot is an organoid (n = 267 organoids, n = 2 mice). Line = non-linear regression. Band = 95% CI of non-linear regression. f Organoid cell number growth rate was calculated from 4 days of time lapse imaging in Matrigel ([final volume-initial volume]/initial volume). Based on the non-linear regression calculated in E, growth rates were corrected to account for organoid core death (detailed equations in Methods section). Blue line = non-linear regressions. Pink line = rolling average. Band = 95% CIs of regressions. n = 522 organoids from 8 mice

