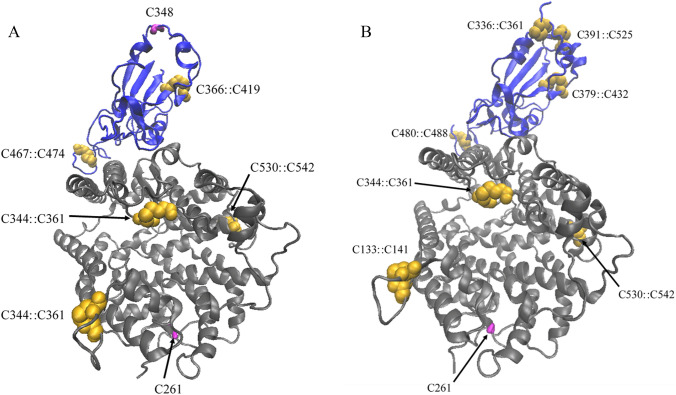
Fig. 2.
Structures of protein complexes of a SARS-CoV⋯ACE2 (PDB: 3D0G) and b SARS-CoV-2⋯ACE2 (PDB: 6M0J). ACE2 shown in gray and spike glycoprotein in blue. Both visualized using New Cartoon drawing method. All the disulfide bridges between cysteine residues are shown in golden vdW spheres and thiol groups in magenta licorice (Color figure online)

