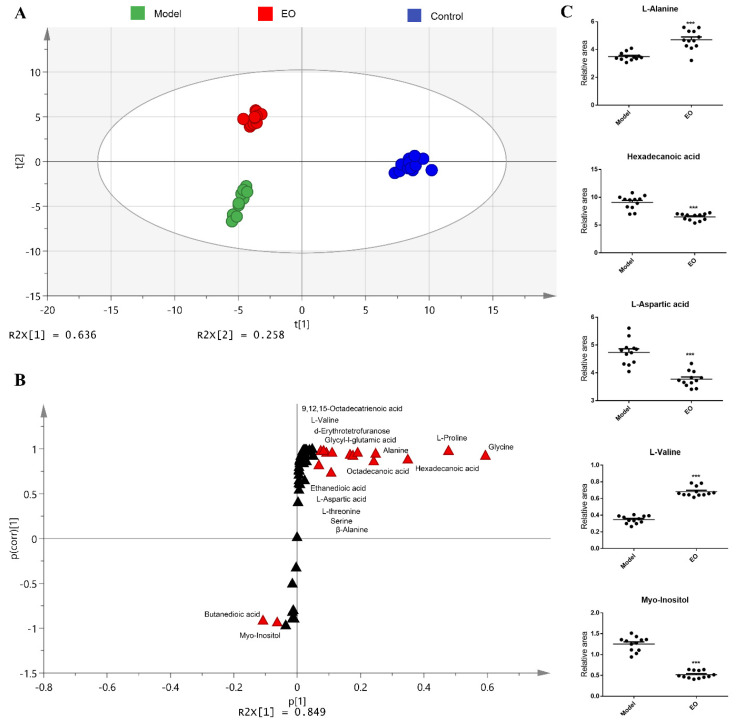
Figure 3.
(A) Principal Component Analysis (PCA) analysis of three groups. Each dot represents the technological replicate analysis of samples. (B) S-plot generated from orthogonal partial least-squares discriminant analysis (OPLS-DA). Dot represents metabolites, which are p [1] < −0.05 or > 0.05 and p (corr) [1] < −0.5 or > 0.5 and marked in red dot. (C) Scatter diagram of five biomarkers, each dot shows a technical replicate. n = 6. *** p < 0.001 vs. model group.

