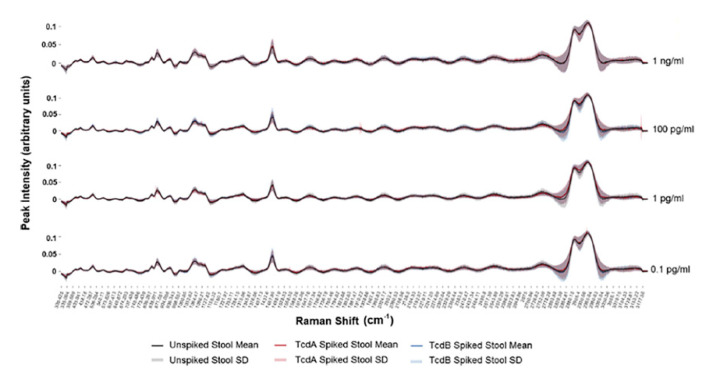
Figure 7.
Mean Raman Spectra: Mean Raman spectra for unspiked stool, TcdA-spiked stool and TcdB-spiked stool with respective standard deviation for 1 ng/mL (top), 100 pg/mL (second from top), 1 pg/mL (third from top) and 0.1 pg/mL (bottom) were plotted on x-axis for Raman shift 300–3200/cm and their intensities in arbitrary units on y-axis [119].

