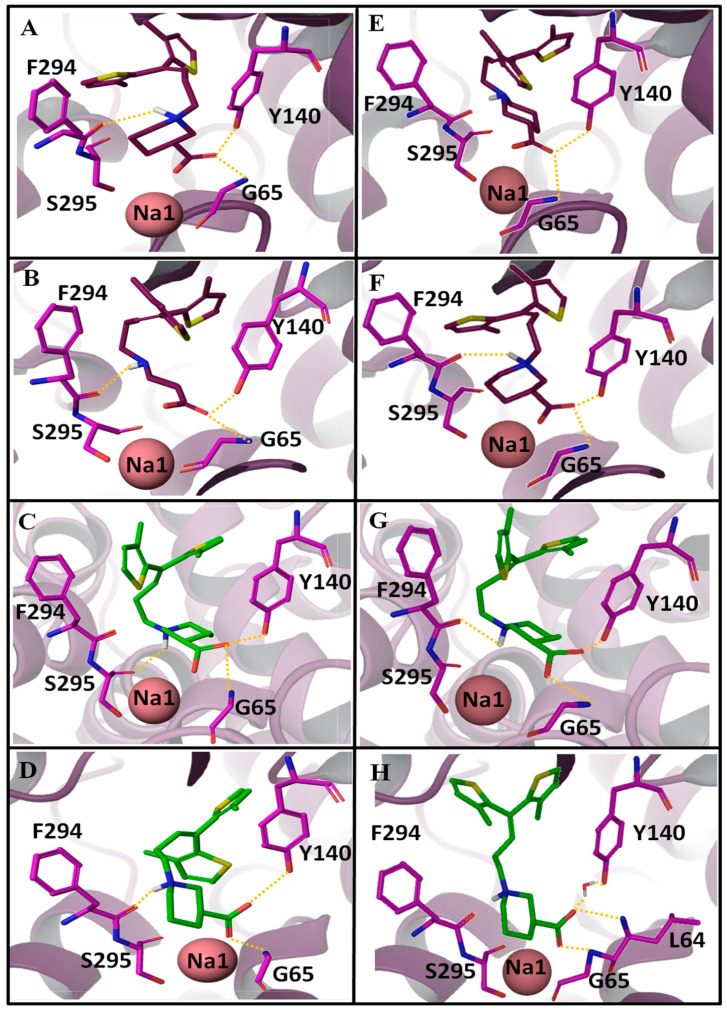
Figure 6.
Comparison of ligand-protein interactions in the selected tiagabine enantiomers (Table 1, entries 3, 4, 6, 9). (A–D) Interaction pattern of entries 3, 4, 6, 9 in the hGAT1 binding pocket embedded in complete membrane-aqueous system at 0 ns and (E–H) after 100 ns of MD.

