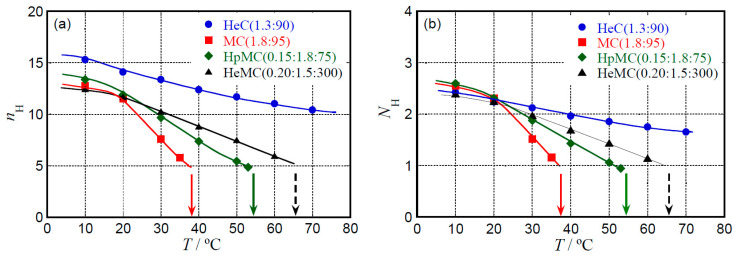
Figure 7.
(a) T dependence of the nH values for HeC(1.3:90), MC(1.8:95), HpMC(0.15:1.8:75), and HeMC(0.20:1.5:300). Solid arrows in this figure represent the lowest cloud point observed in a high concentration side, i.e., lower critical solution temperature (LCST). A dotted arrow represents a gelation point without turning into the turbid state for aqueous solution of HeMC(0.20:1.5:300) at 0.1 M. (b) T dependence of the NH values for each chemically modified cellulose sample.

