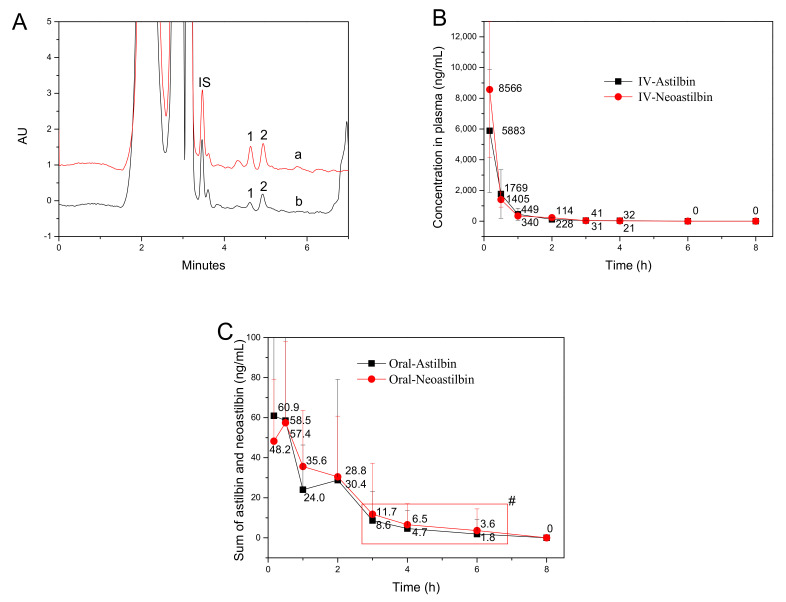
Figure 5.
(A) Typical chromatograms of rat plasma at 30 min after oral administration of astilbin (a) and neoastilbin (b) (detected at 291 nm); (B) mean plasma concentration–time curves of astilbin and neoastilbin after intravenous administration (2 mg/kg) in rat. (C) Mean plasma concentration–time curves of astilbin and neoastilbin after oral administration of astilbin and neoastilbin suspensions (20 mg/kg) in rat; peaks: 1, neoastilbin; 2, astilbin; IS, rutin. #These data in the red box were below the lower limit of quantitation (LLOQ) of the quantified method. Hence, the accuracy of these digits was uncertain, but the presence of the flavonoid in plasma was confirmed.

