Figure 2.
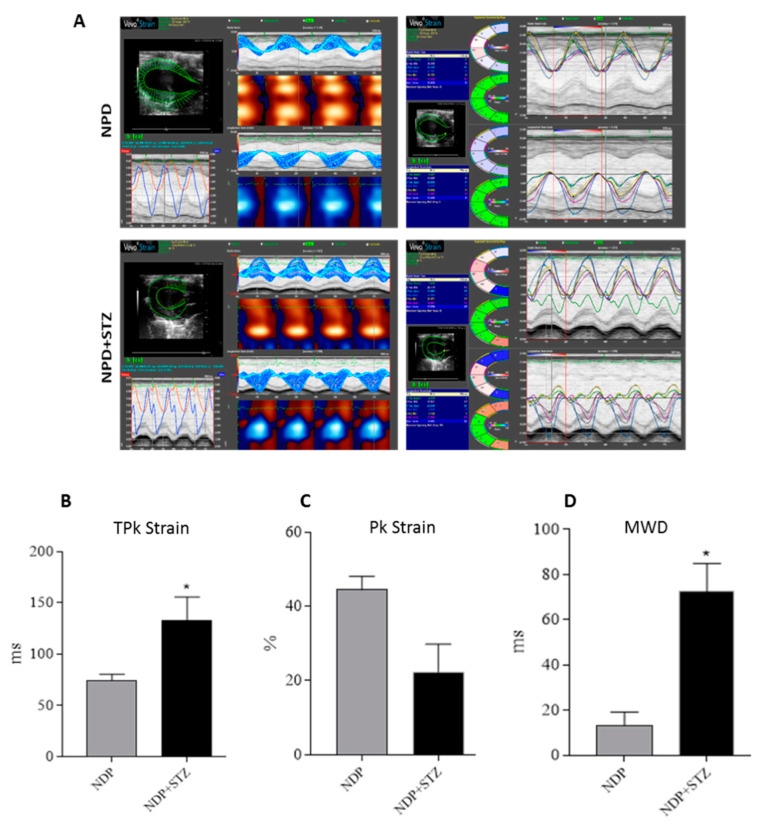
Cardiac tissue strain analysis. (A) Representative parametric displays, area/volume graphs, and segmental synchronicity page related to endocardial strain analysis of parasternal short-axis view (PSLAX) assessed in radial motion at the end of experimental period. (B) Average of time-to-peak (TPk) of the six segments of cardiac wall in endocardial strain analysis. (C) Whole peak capacity, assessed as the peak average (Pk) of the six segments of cardiac wall, in endocardial strain. (D) Maximum wall delay (MWD) of LV during radial motion in endocardial strain analysis. The data are presented as mean ± SEM. * p < 0.05 vs. NPD, Mann–Whitney test, n = 6/group.

