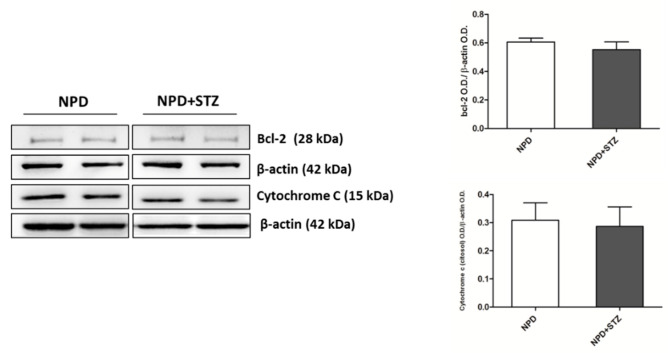
Figure 5.
Bcl-2 and cytochrome C expression in hyperglycaemic and normoglycaemic animals. Western blot analysis showed no changes in Bcl-2 and cytochrome C expression between the two groups. On the left, representative images of Western blot assay; on the right, densitometric analysis. The data are presented as mean ± SEM. n = 6/group (t-test).

