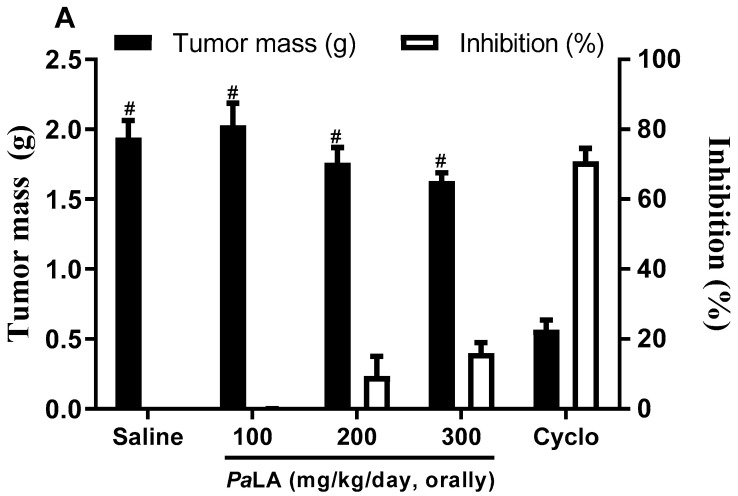
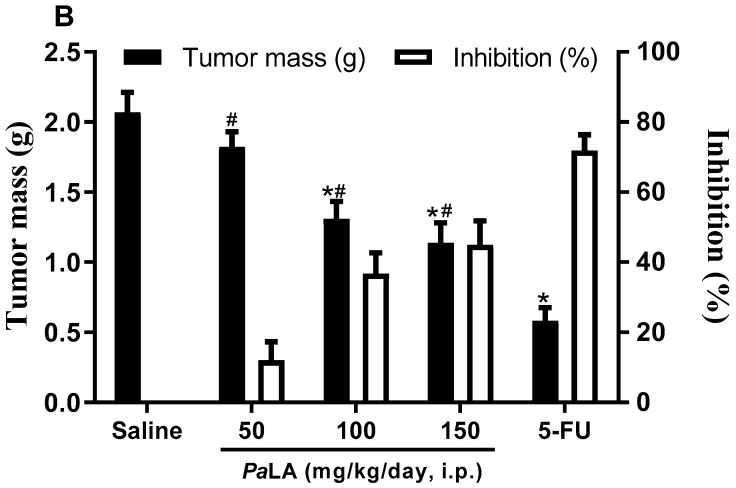
Figure 2.
The effect of PaLE in mice inoculated with S180 cells. The graphs show the tumor mass in grams (g) and degree of growth inhibition (%). The animals were treated orally (A) and i.p. (B), starting one day after the tumor implantation, for 7 consecutive days. Saline was used as a negative control. 5-FU 25 mg/kg/day and Cyclophosphamide 15 mg/kg/day (cycle) were used as a positive control. Data are presented as mean ± standard error of the mean (n = 7–10 animals/group) and the results evaluated by one-way analysis of variance (ANOVA) with a Student Newman Keuls post-test. * p < 0.05 compared to the saline group, # p < 0.05 compared to the 5-FU or Cyclo group.


