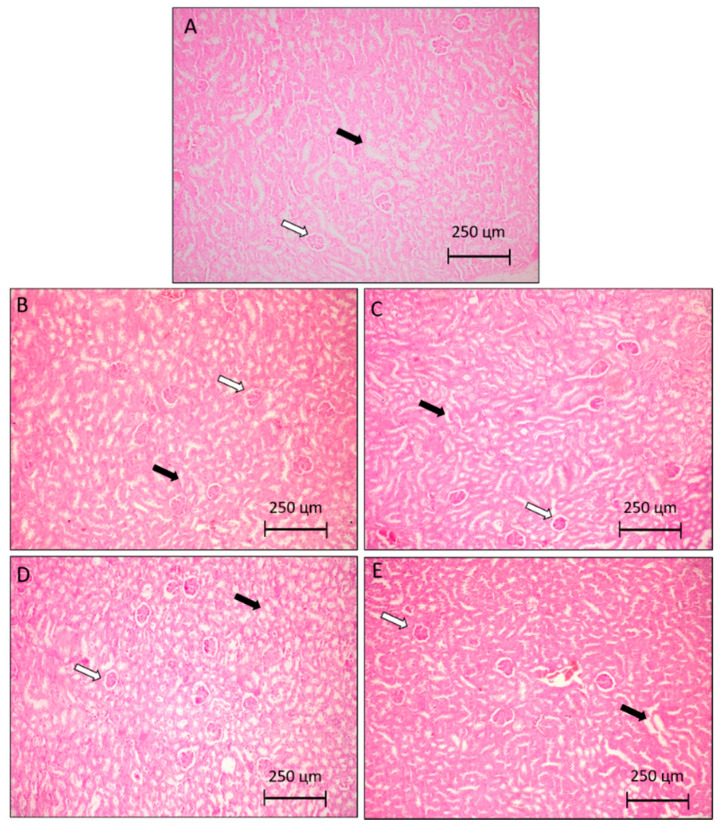
Figure 5.
Photomicrographs representative of kidney histology (5 µm). Control group (A), are animals without tumor S180 treated with the vehicle (saline). The control group (B), are animals with tumor S180 treated with the vehicle (saline). Group (C,D) are animals with S180 tumor treated with PaLE 100 and 150 mg/kg/day, respectively. The positive control group (E), are animals with S180 tumor treated with 5-FU 25 mg/kg/day. The hollow arrows indicate Bowman’s space and arrows filled with preserved proximal twisted tubules. 100× magnification.

