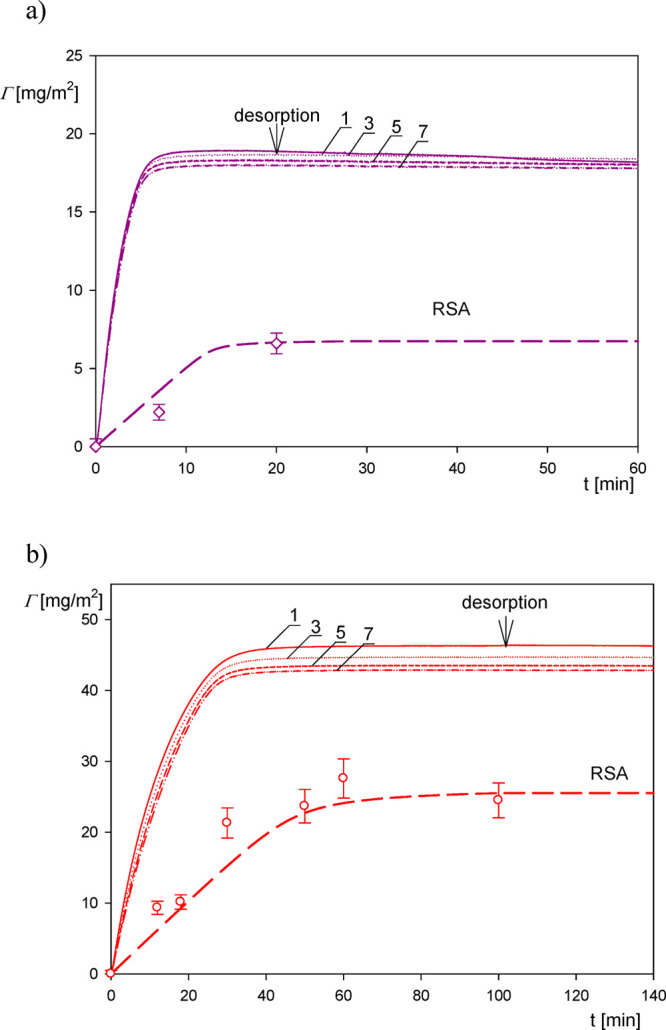
Figure 2.

Kinetics of particle deposition derived from QCM-D measurements using the Sauerbrey equation for various overtones (solid lines denoted by 1, 3, 5, 7); silica sensor, pH 4, volumetric flow rate 2.5 × 10⁻³ cm3 s–1. (a) A20 particle suspension; the bulk concentration is 10 mg L–1. (b) A70 suspension; the bulk concentration is 20 mg L–1. The points represent the experimental dry mass derived from AFM, and the dashed lines denote the theoretical dry mass results derived from the RSA model.
