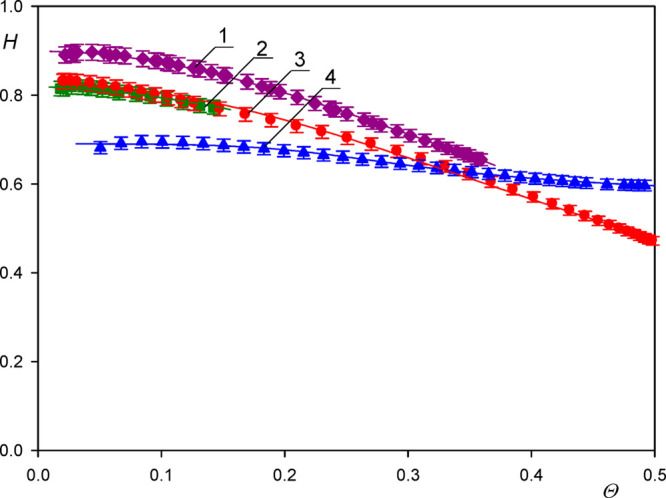
Figure 3.

Dependence of the function  on the dry coverage of particles Θ
determined for various particle sizes; silica sensor, pH 4, ionic
strength 0.01 M; for calculating the QCM coverage, the first overtone
was used. 1, A20; 2, L40; 3, A70; 4, A140 suspension. The points show
the experimental values calculated from eq 4; the lines represent fits of experimental
data.
