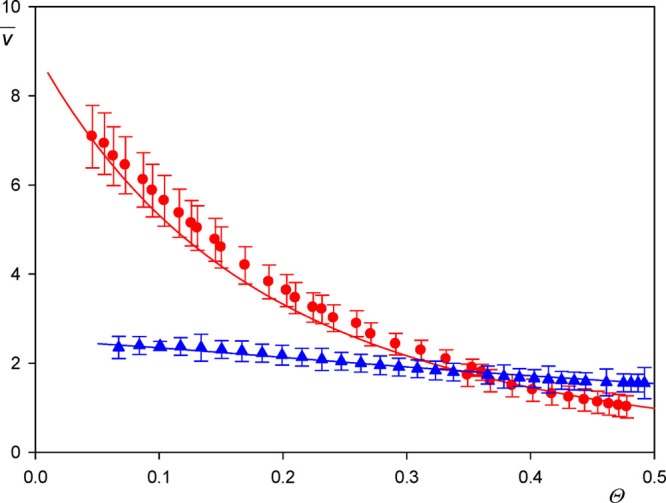
Figure 4.

Dependence of the hydration function v̅ (averaged over the A20, L40, and A70 suspensions and various overtones) (red points) on the dry coverage of particles Θ; silica sensor, pH 4 and 5.7, ionic strength 0.01 M. The solid line denotes the theoretical results calculated from the fitting function given by eq 6. The blue points show the results obtained for the A140 particles, where results for the first overtone are presented.
