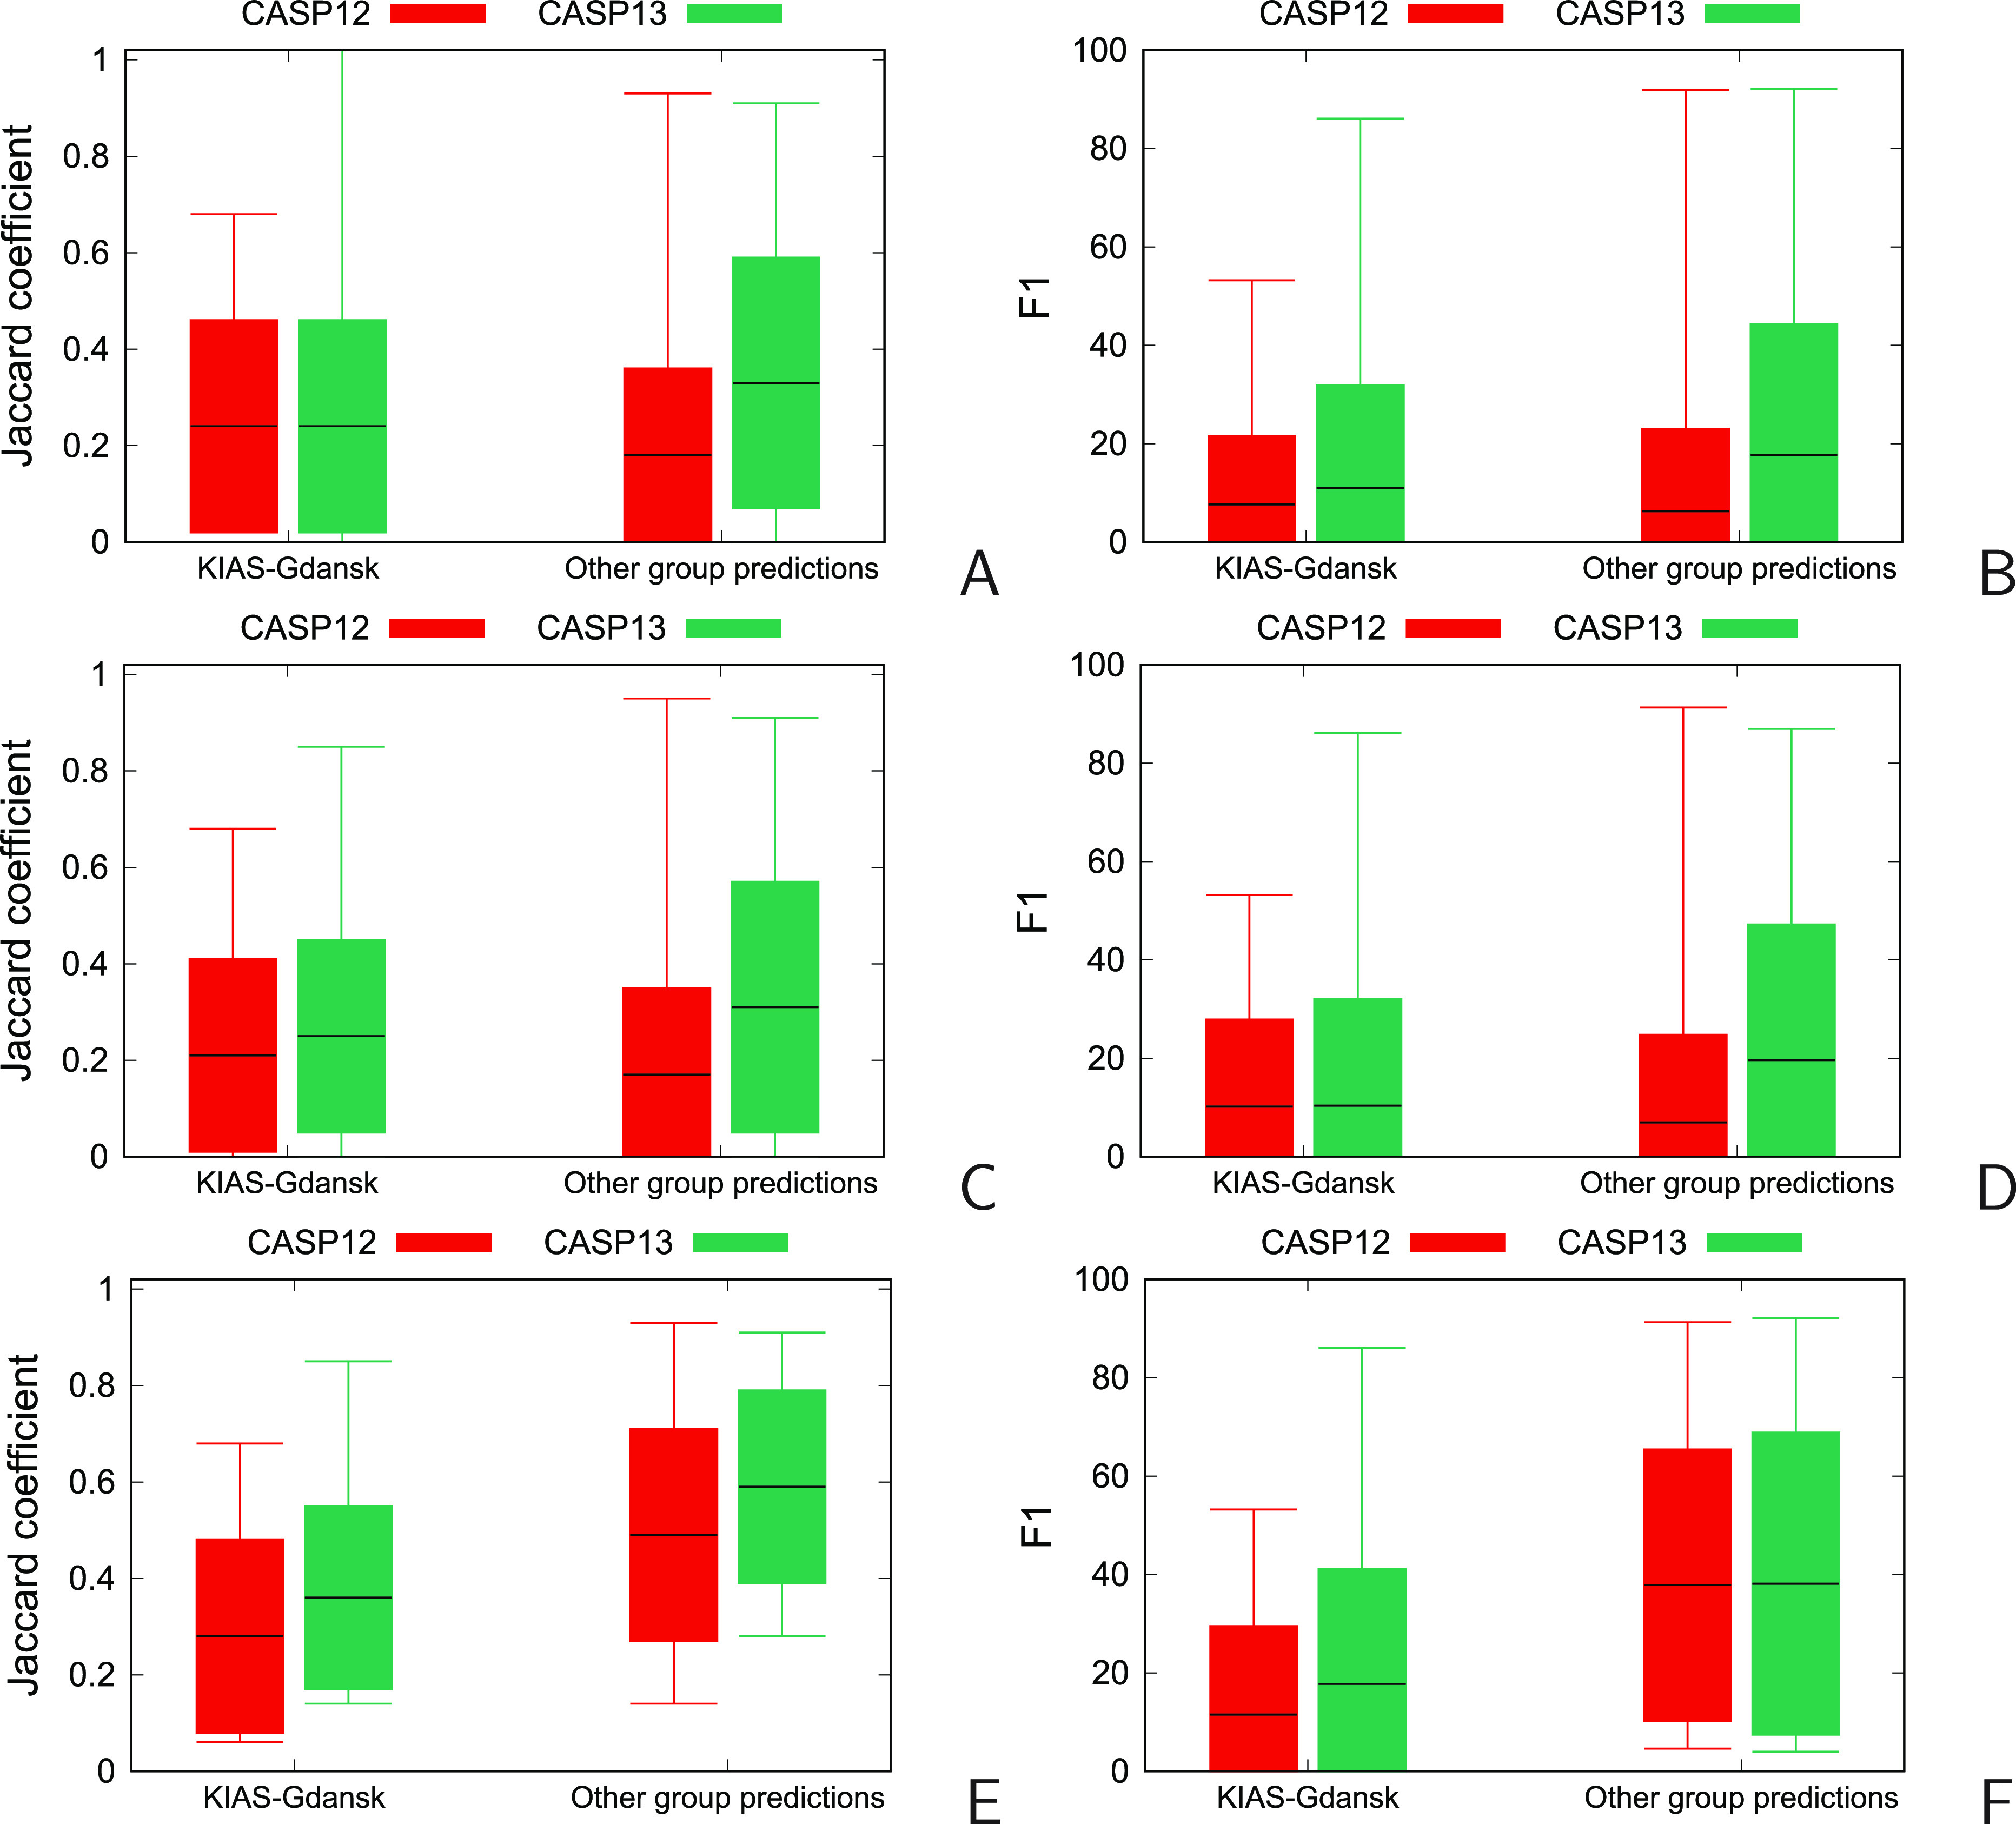
Figure 13.

Candlestick plots of the Interface Patch Similarity (IPS), quantified as the Jaccard coefficient34,35 (A, C, E) and the Interface Contact Similarity (ICS) quantified as the F1 score (B, D, F) of the KIAS-Gdansk models of oligomeric targets (left pairs of sticks) and other group models (right pairs of sticks) obtained in the CASP12 (red) and CASP13 (green) experiments. Panels A and B: all models; panels C and D: “Model 1” predictions; panels D and E: best models (with the highest score as determined by CASP assessors). The horizontal lines in the middle of each bar correspond to the mean values; the bars range from the mean minus the standard deviation to the mean plus the standard deviation, and the whiskers correspond to the minimum and maximum values. The negative values are clipped in all plots.
