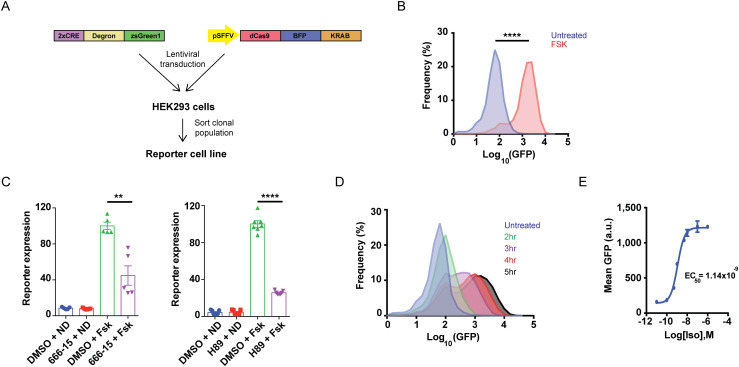
Fig 1. A robust CREB transcriptional reporter for GPCR/cAMP activity.
(A) Schematic representation of the CREB reporter used in the CRISPR-based screen. Two cAMP response elements were fused to a ProteoTuner destabilizing domain (degron) followed by a green fluorescent protein, and inserted into a lentiviral vector. A clonal cell line was generated by transducing HEK293 cells with the reporter and dCas9-BFP-KRAB, sorting individual cells, and growing and verifying clonal lines for high reporter expression and efficient dCas9-dependent gene silencing. (B) The CREB reporter responds robustly to direct stimulation of adenylyl cyclase/cAMP signaling with forskolin. Reporter cells were treated with 10 μM forskolin (FSK) or DMSO (vehicle), and 1 μM Shield-1 was added simultaneously to stabilize the degron domain. After 4 h, reporter expression was analyzed by flow cytometry. Data from n = 4 per condition. (C) The CREB and PKA inhibitors, 666–15 and H89, respectively, significantly diminish FSK-induced accumulation of the reporter. Cells were pre-incubated with 100 nM 666–15 or 10 μM H89 versus DMSO (vehicle) for 30 min, then treated with 10 μM FSK in the presence of 1 μM Shield-1. After 4 h, reporter accumulation was analyzed by flow cytometry. Data plotted are from n = 5 for 666–15 and n = 7 for H89. (D) Timecourse for β2-AR-dependent reporter induction. Reporter cells were treated with 1 μM isoproterenol / 1 μM Shield-1 for indicated times or treated with 1 μM Shield-1 alone (no isoproterenol) for 5 h (“untreated”), and reporter expression was analyzed by flow cytometry. Data from n = 5. (E) Dose-response curve for isoproterenol-dependent reporter expression. Reporter cells were treated with indicated doses of isoproterenol and 1 μM Shield-1 for 4 h, and reporter expression was analyzed by flow cytometry. Data plotted are means of GFP expression, n = 3 per condition. EC50 curve-fitting was performed using Prism6 GraphPad software. In each flow cytometry experiment, 10,000 cells total were analyzed and gated for singlets. Error bars = ± s.e.m. **** = p ≤ 0.0001; ** = p ≤ 0.01 by unpaired two-tailed Student’s t-test.

