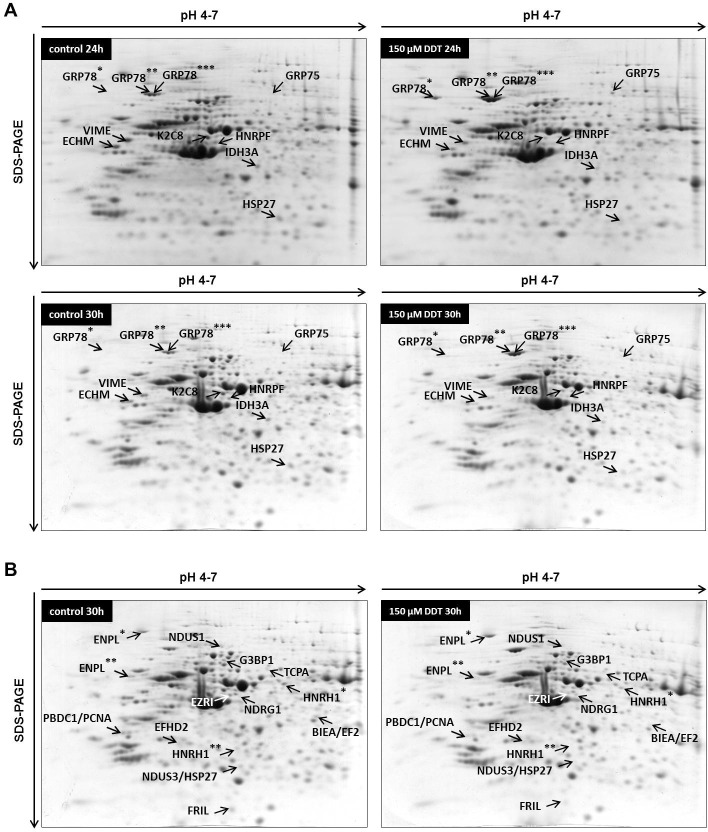
Fig 4. Representative 2-DE gels (pI range 4–7) of NES2Y cells exposed to 150 μM p,p‘-DDT in DMSO for 24 hours and 30 hours.
Part A shows spots/proteins that changed their expression after both 24-hour and 30-hour exposure. *, **, *** mark different spots identified as the same protein. Part B shows spots/proteins that changed their expression only after 30-hour exposure. *, ** mark different spots identified as the same protein. BIEA/EF2, NDUS3/HSP27, and PBDC1/PCNA represent spots that contained two different proteins. For the full names of detected proteins, see Tables 1 and 2.

